

It's day 29 of the 30 Day Map Challenge, and today's theme is Raster.
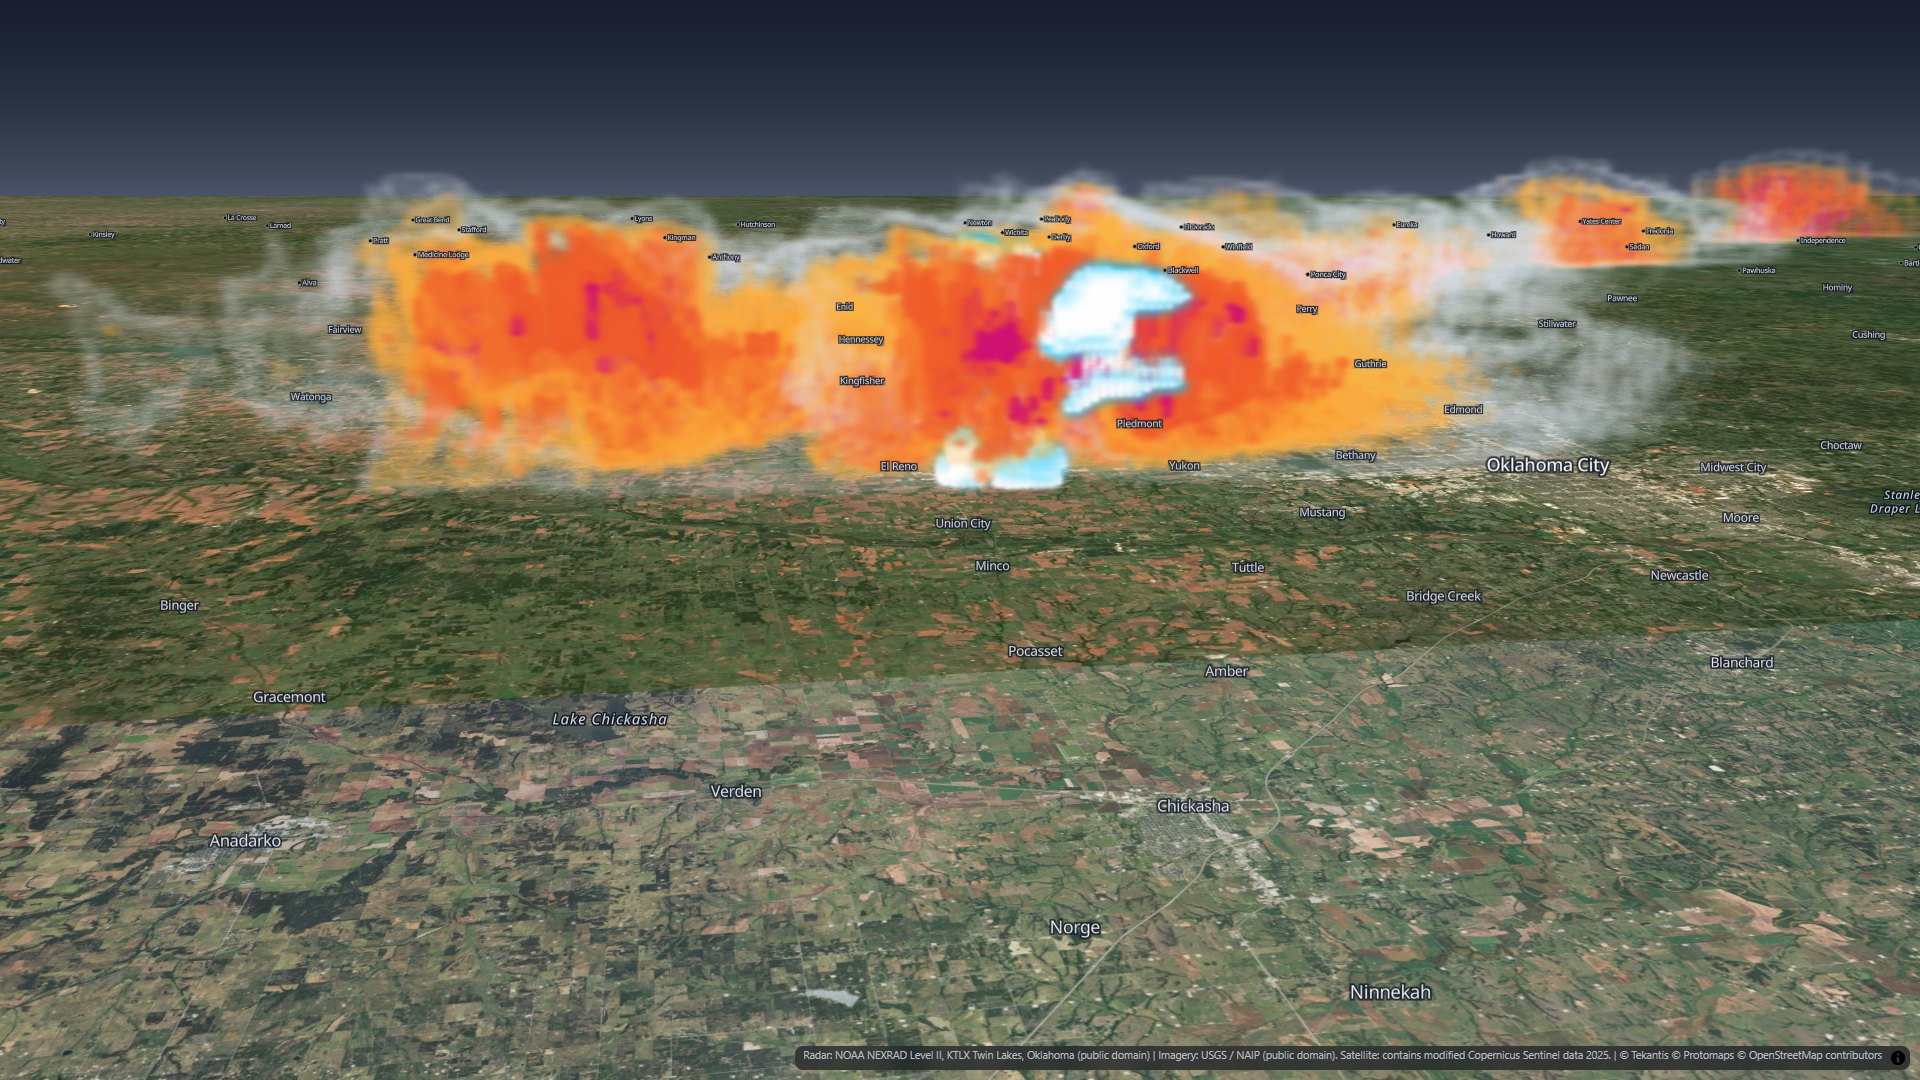
A weather radar is a raster that scans in 3D. Every few minutes it sweeps the sky at a stack of tilts, from just above the horizon to almost 20 degrees up, and every gate along every beam is a cell with a value. Most radar maps flatten all of that into a single picture. Today's map keeps the third dimension.
It is the El Reno storm of 31 May 2013 in Oklahoma, the storm that produced the widest tornado ever recorded. Eleven volume scans from the Oklahoma City radar, 47 minutes from 6:00 to 6:47 pm local time, each gridded into a 3D raster, with every cell drawn as a soft, see-through splat. Press play and the storm moves across the map.
The El Reno storm
On the evening of Friday 31 May 2013 a supercell thunderstorm crossed the open country west of Oklahoma City. Just after 6 pm local time it put down a tornado near El Reno that grew, in a few minutes, to 2.6 miles (4.2 km) across: the widest tornado ever recorded. It stayed on the ground for about 40 minutes. Eight people were killed, among them the storm researchers Tim Samaras, Paul Samaras and Carl Young.
The Twin Lakes radar, KTLX, the National Weather Service radar for Oklahoma City, was about 65 km away and scanned the storm every four and a half minutes. Those scans are public, and they are the whole of today's map.
The whole storm
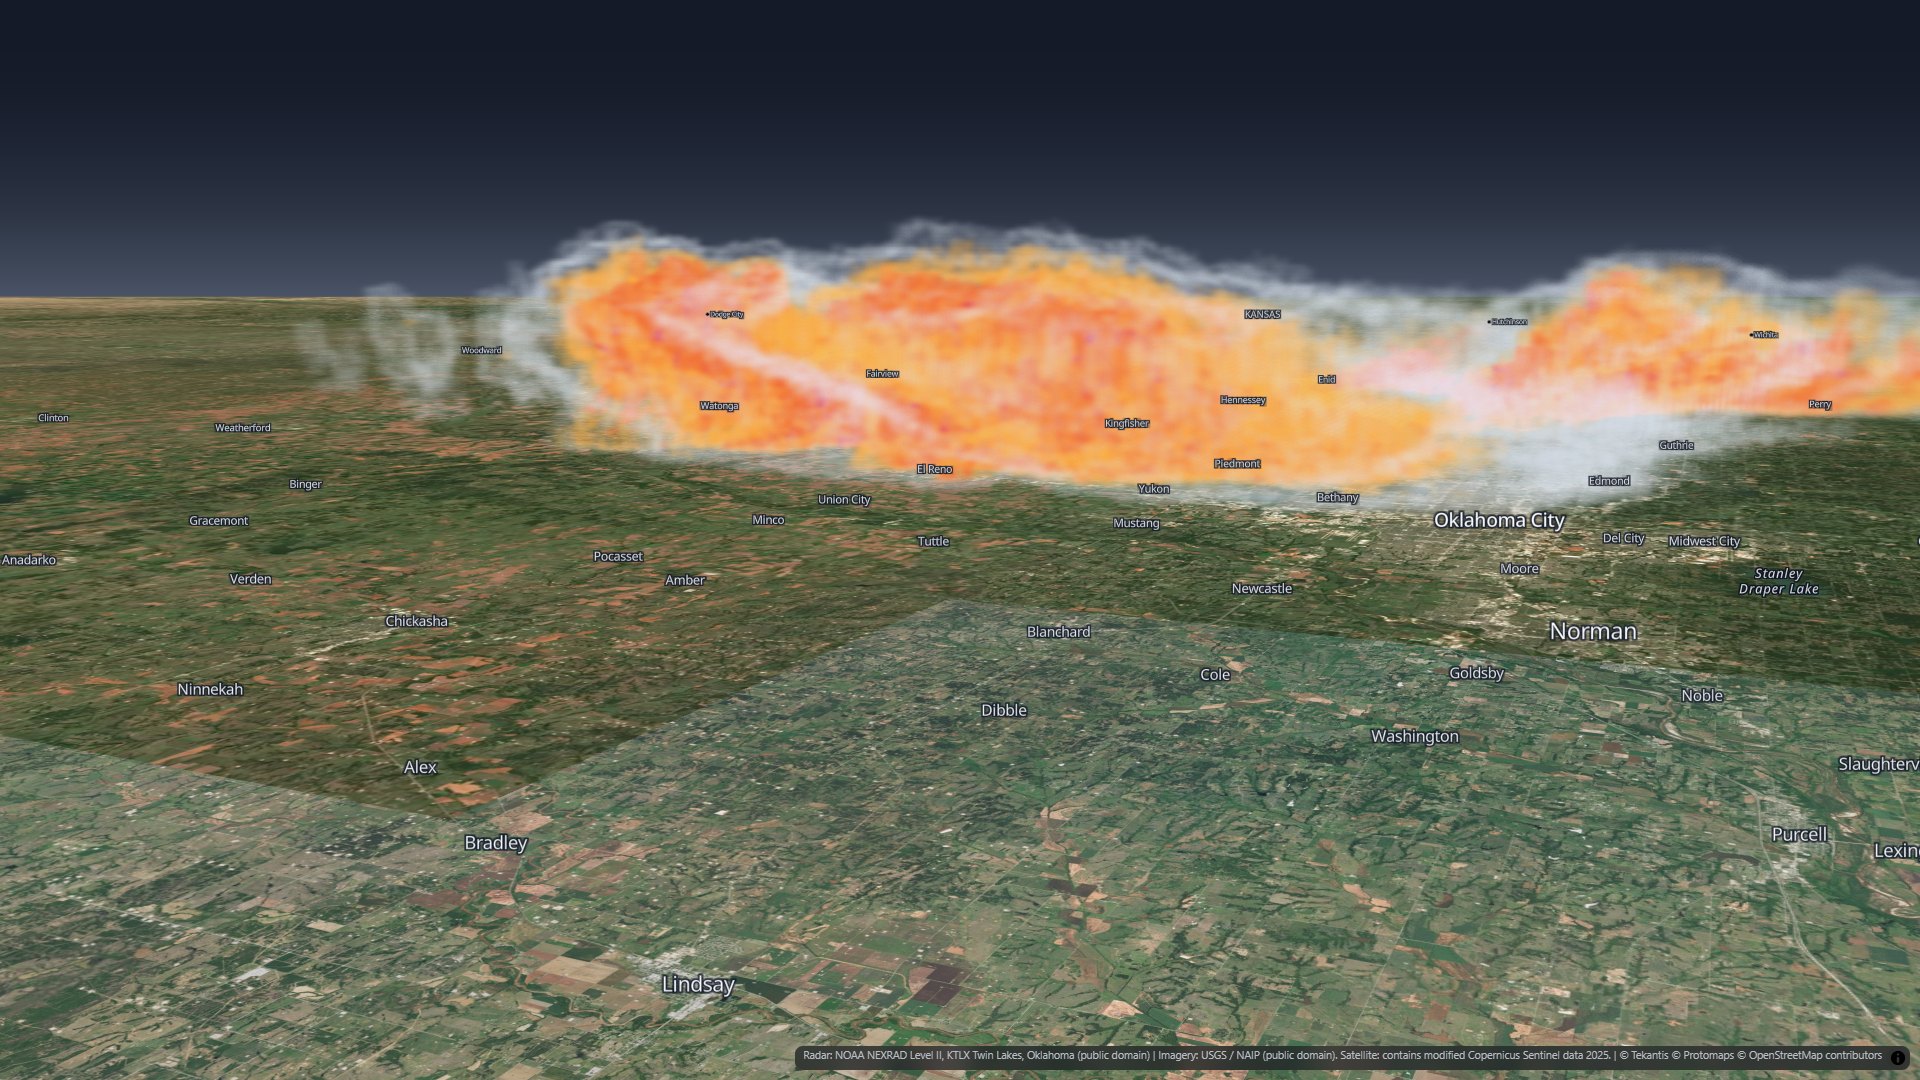
From outside, the storm is a wall of rain 18 km tall. The colors are reflectivity bands, how strongly the rain and hail send the radar beam back: grey-white for light rain, amber for heavy rain, red for very heavy rain, and magenta and white for the strongest returns, where hail is likely.
A filled 3D raster would be a solid block from outside, so the map draws only the outer surface of each band. Each band is see-through, so the stronger ones show through the weaker ones around them.
Cut open along the hook
The second bookmark cuts the storm open along its hook, the curl at its southern end where a tornado forms, using a clip area on the splat layer. Inside are the hail cores, and under them a white column with a cyan edge.
Where the storm was spinning
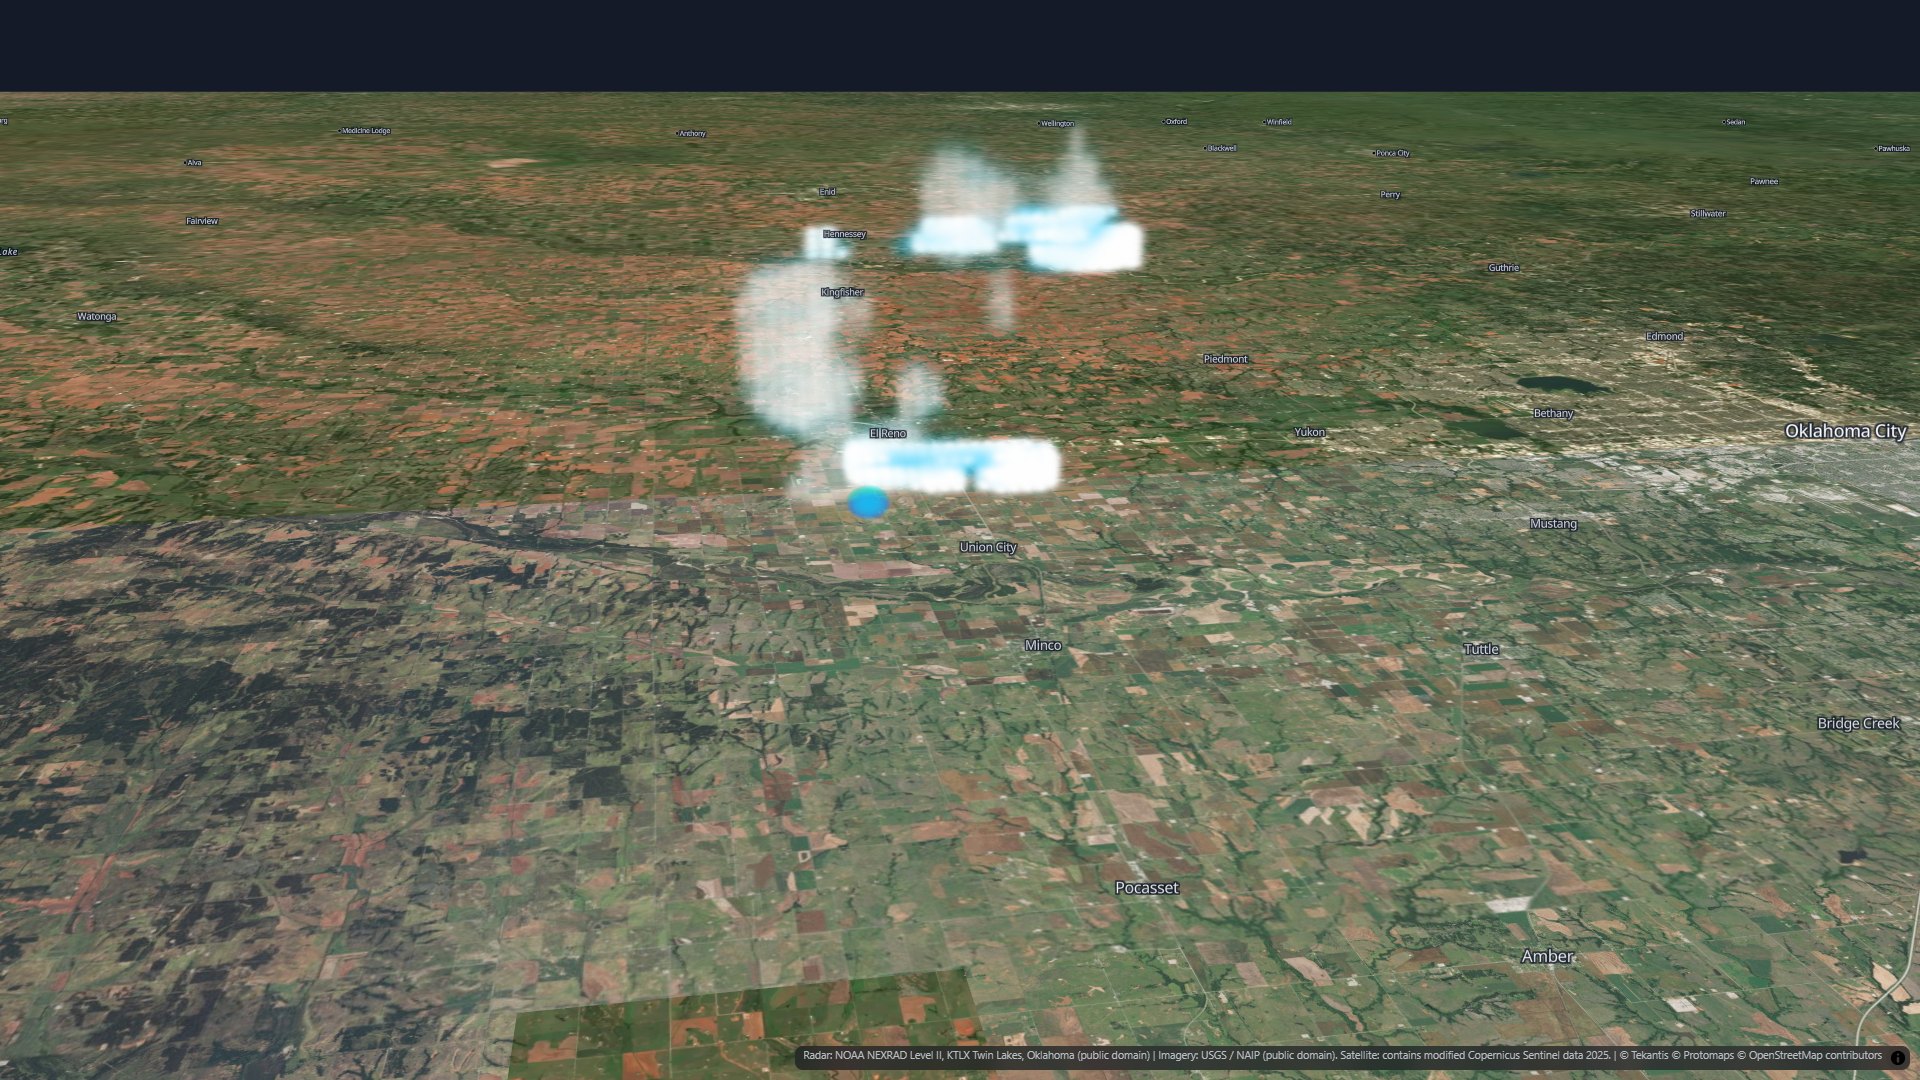
A radar like KTLX measures more than how much rain there is. It also measures how fast the rain is moving toward it or away from it. Where the wind on one side of a spot blows toward the radar and the wind on the other side blows away, the air is spinning.
The rotation layer marks where that spin is strong. From 6:14 to 6:23 pm it is a column from the ground to 13-16 km, right under the hook, while the tornado was on the ground and growing to its full width. Before and after, only fragments of it pass the same threshold.
The whole line
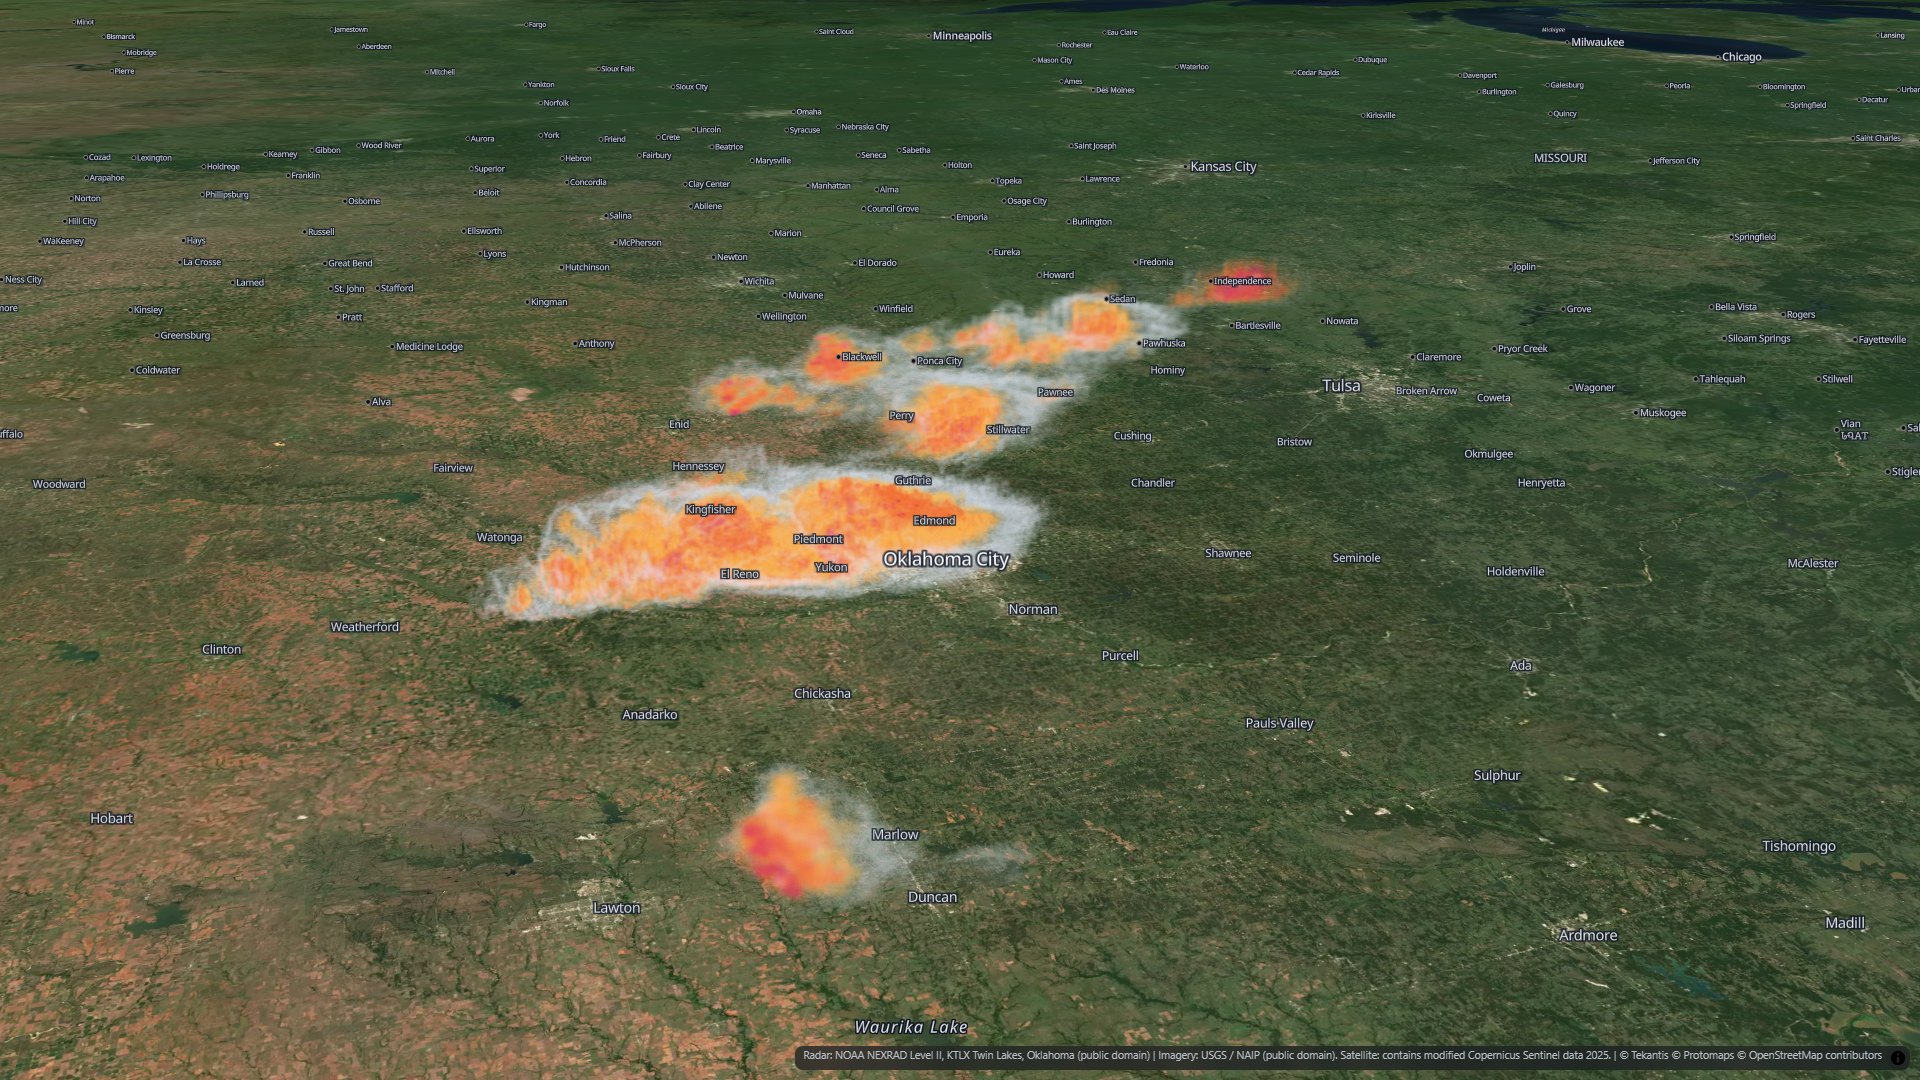
The El Reno storm was not alone. It was the southern end of a line of storms reaching north-east toward Kansas, with a smaller storm to the south. The fourth bookmark shows the whole line, out to 230 km from the radar.
From radar scans to a 3D raster
The scans are NOAA NEXRAD Level II data: every gate of every sweep, at 14 tilts from 0.5 to 19.5 degrees, with gates every 250 m along the beam. To turn each scan into a map layer:
- Where is each gate? A radar beam leaves the antenna in a straight line, but the earth curves away beneath it and the air bends it gently back down. The standard model for that puts every gate at its true height and distance from the radar.
- A regular grid. The gates are resampled onto a 3D raster: cells 500 m across and 250 m deep over 130 km by 115 km around the storm, and 1 km by 500 m beyond that, out to 230 km from the radar, all the way up to 18 km. Between the tilts the values are interpolated.
- Splats. Each cell on the surface of a reflectivity band becomes one Gaussian splat, a small soft blob of color. That is up to 320,000 splats a scan.
- The rotation. From the radar's wind sweeps: the folded wind speeds are unfolded, then the spin is measured across a few hundred metres at every point and put on the same grid.
What's new in Icon Map for Fabric
Splat layers can now be a series of frames on the time slider. Give the layer one file per moment and the slider plays them back, blending one into the next, like any raster time series. Today's map has three of them: the storm, the cut-open storm and the rotation, eleven frames each.
Building this map also found and fixed a problem with splats a long way from the camera, which drifted toward the middle of the view, so a scene hundreds of kilometers across like this one now stays in place at any zoom.
How accurate is it?
A radar sees rain and hail, not cloud. The storm you would have seen from the ground, with its anvil spreading out at the top, was bigger than what is drawn here.
The lowest beam passes 0.7 to 0.9 km above the ground at the storm, so the bottom of the map is filled in from above, not measured. The storms far from the radar are seen only from 3.5 to 5 km up, which is why the map fades them out between 180 and 230 km. And straight above the radar there is no data at all.
The scans are four and a half minutes apart. The time slider blends one into the next, but the motion in between is not observed.
The rotation layer shows where the winds were spinning on a 500 m grid. That is the whole spinning part of the storm, not the tornado itself, which was narrower than a cell. It is a picture of the storm's rotation, not a record of the tornado's path or strength.
Credits
Radar: NOAA NEXRAD Level II, KTLX Twin Lakes, Oklahoma (public domain), read and gridded with MetPy. Aerial imagery: USGS / NAIP (public domain); satellite imagery where there is no aerial photo contains modified Copernicus Sentinel data 2025. The El Reno tornado's width, timing and toll: the National Weather Service, Norman. Basemap © IconMap, © OpenStreetMap contributors.