

It's day 28 of the 30 Day Map Challenge, and today's theme is Senses: Feeling.
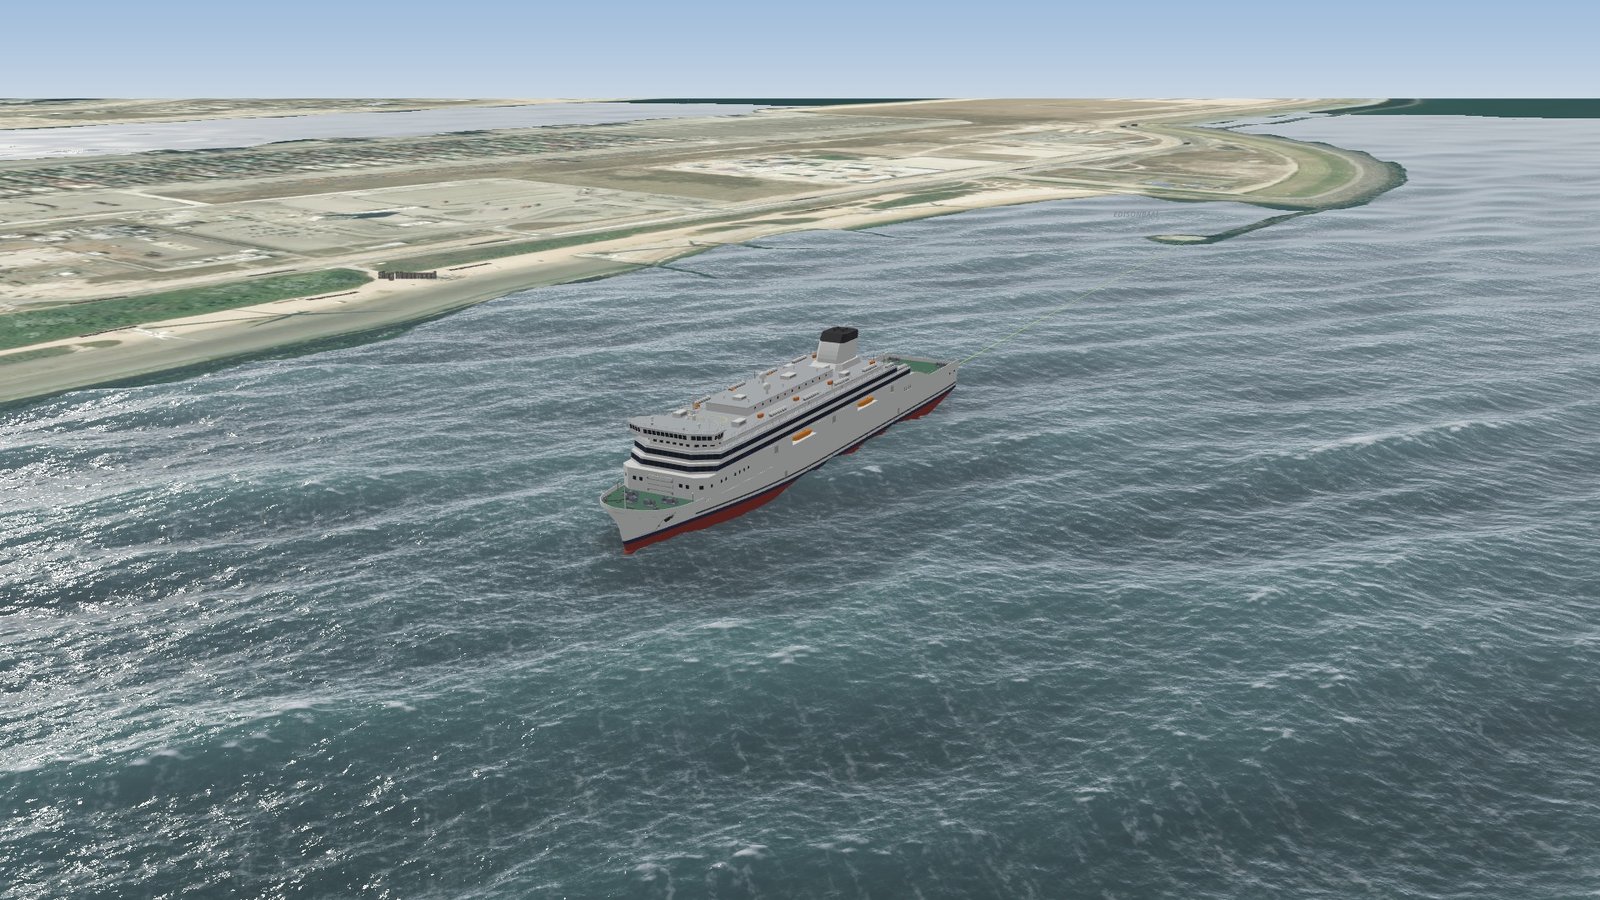
Most maps of the sea tell you how high the waves are. What a passenger wants to know is how the crossing is going to feel. So today's map takes twelve ferry crossings around Britain and Ireland on the evening of Storm Isha, 21 January 2024, and colors each one by how rough it would have felt on board, from a gentle sway to "hold the handrail".
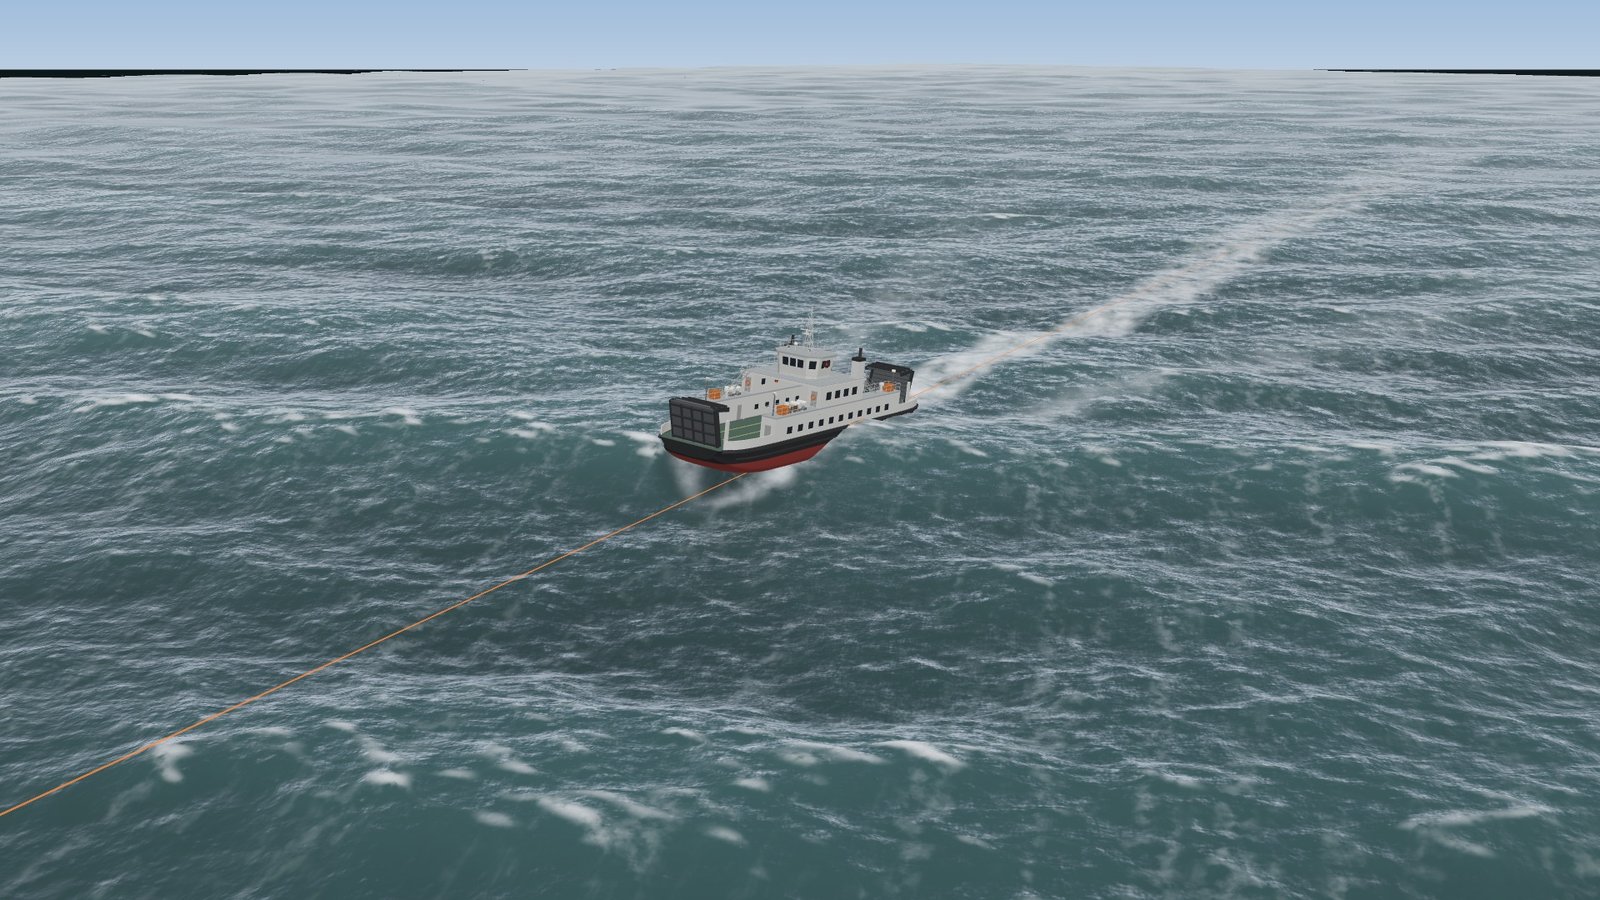
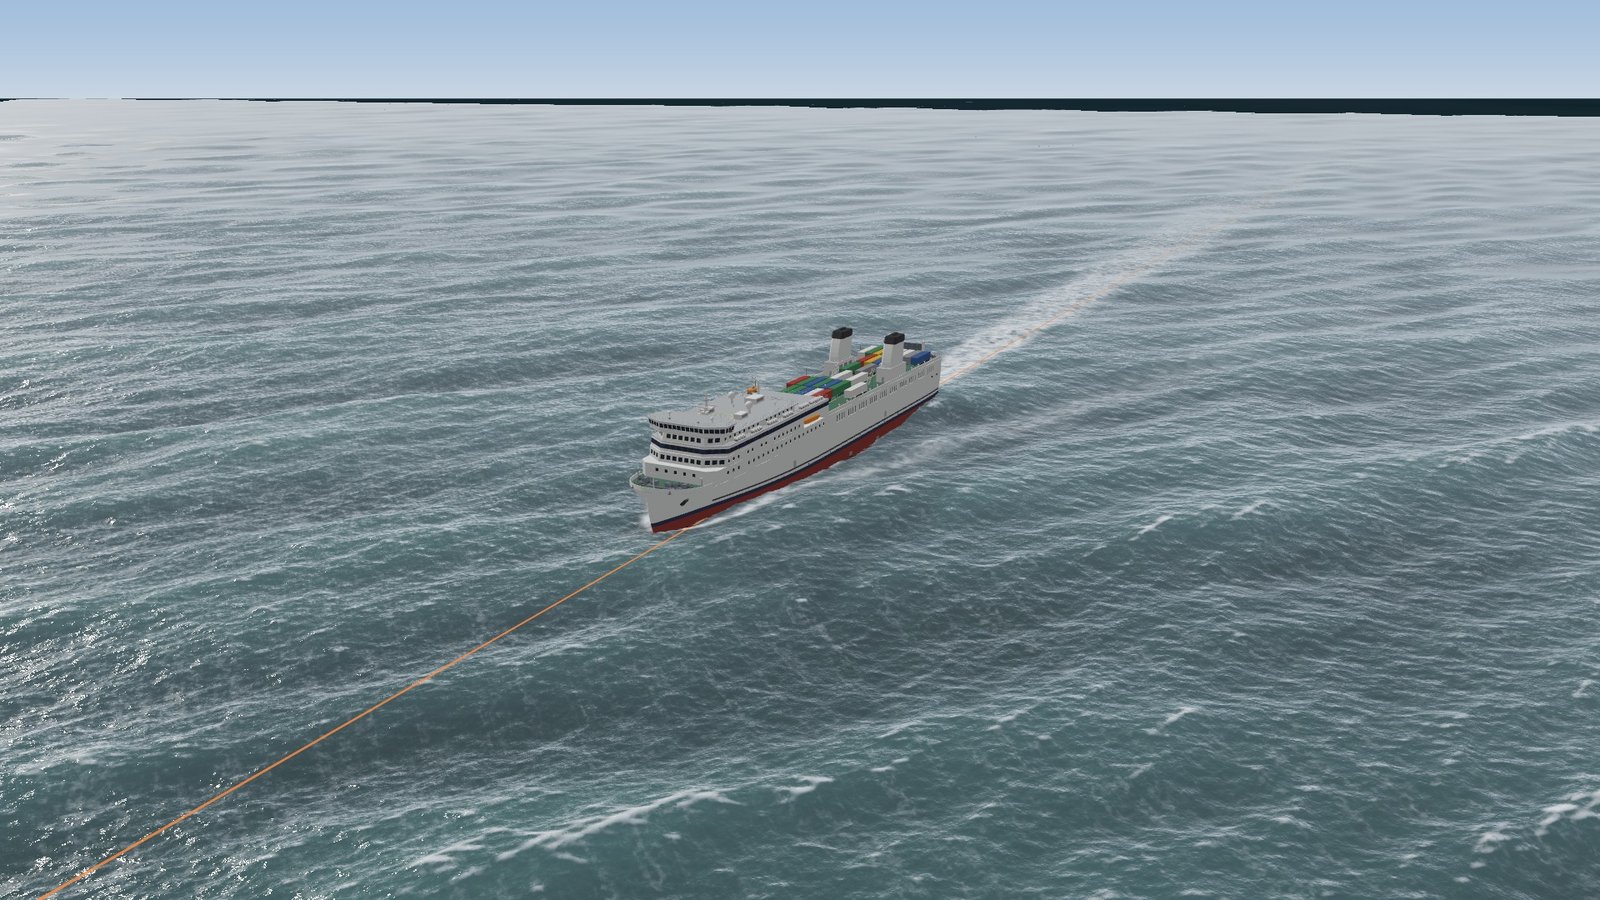
Under the lines is a 3D storm sea, and on it a ferry sails each crossing, rising, pitching and rolling with the waves under its hull. Zoom right in to ride along, or zoom out and the same sea covers the whole map.
Storm Isha
Storm Isha crossed Britain and Ireland on Sunday 21 January 2024, with gusts close to hurricane force over the Irish Sea. Sailings were cancelled across the region. Stena Line's Stena Estrid left Birkenhead for Belfast at 10:30 that morning, on a crossing of about eight hours. It could not get into port, and spent around ten hours circling off the mouth of Belfast Lough before it docked at 04:30 on Monday.
The map scores every crossing for 21:00 UTC that evening, when the storm was at its height over the Irish Sea.
How rough was each crossing?
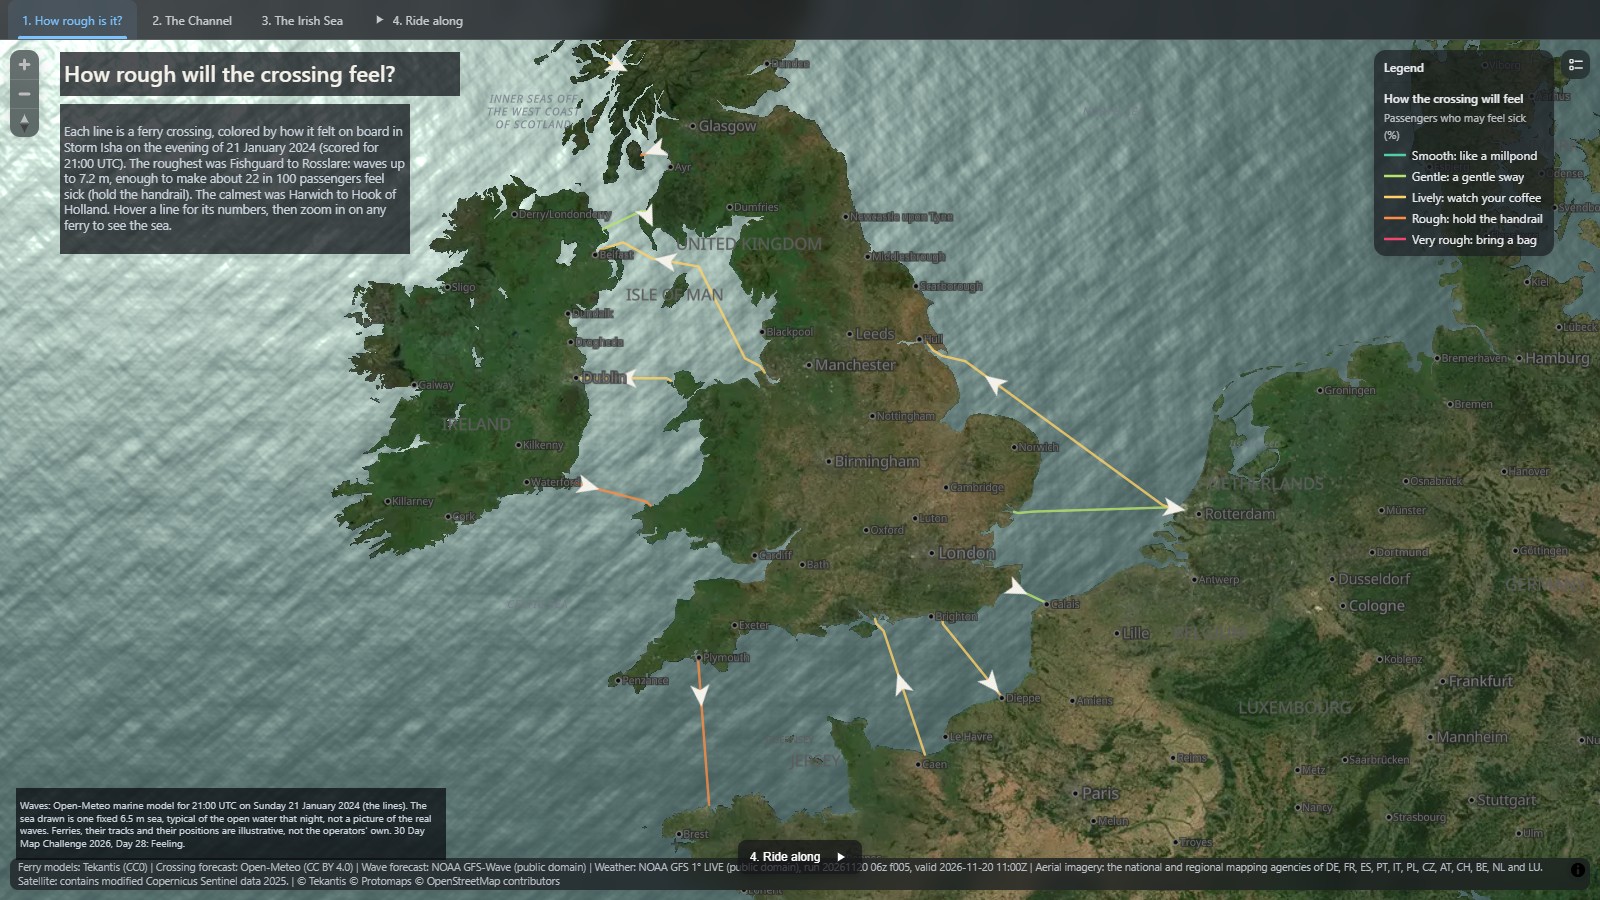
The roughest was Fishguard to Rosslare, across St George's Channel, with waves up to 7.2 m. About 22 in 100 passengers who are not used to the sea would have felt sick. Plymouth to Roscoff, across the open western Channel, was close behind at 19 in 100.
The surprise is Ardrossan to Brodick, the 55 minute crossing to the Isle of Arran. Its waves were less than half the height of St George's Channel, but it scores just as badly, because the ship is a 50 m island ferry, not a 186 m ro-pax. A small hull rides every wave. A big one bridges them.
At the other end, Harwich to the Hook of Holland, in the lee of England, scores under 2 in 100: a gentle sway.
From waves to feeling
There is a standard for this. ISO 2631 and its British forerunner, BS 6841, turn motion into a motion sickness dose: how hard the floor moves up and down, and for how long. Roughly a third of that dose is the percentage of people who will be sick. So the map needs to know how each ship moves in each sea. It works it out in three steps:
- The sea. The Open-Meteo marine API holds the wave model's own record of past storms. For each crossing I read the height, period and direction of the wind waves and the swell at five points along the track, for 21:00 UTC.
- The ship. The same model that floats the ferries on the map's 3D sea sails a hull of the right length and beam through that sea at its service speed for ten minutes, and measures how hard the deck moves up and down a quarter of the way back from the bow.
- The feeling. That acceleration, over the length of the crossing, gives the dose, and the dose gives the share of passengers likely to feel sick. The map splits it into five classes: under 1 in 100 smooth, then gentle, lively, rough, and 30 or more in 100 very rough.
What's new in Icon Map for Fabric
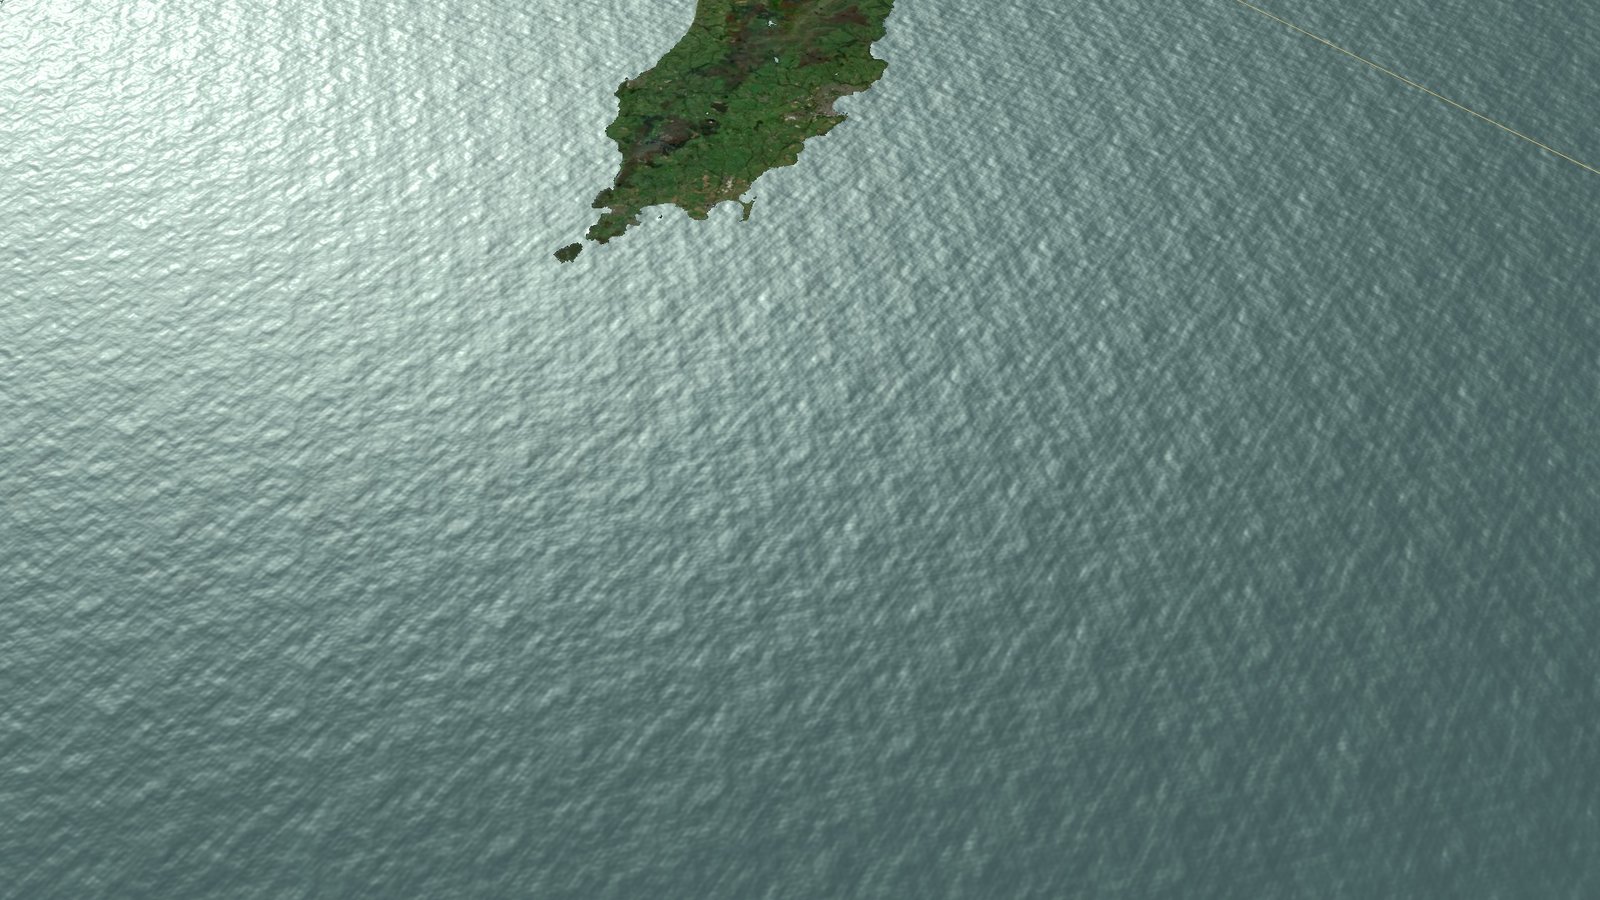
The sea for today's map is new in Icon Map for Fabric:
- 3D waves. Turn on 3D waves in a Wave height weather layer and, as you zoom in, the sea becomes a real wave surface: waves with height you can look along, whitecaps where they break, foam streaks down the wind and the sun glinting off the water. Zoom out and the same sea carries on across the whole map, matched in color, so the effect is part of the map, not a close-up.
- A fixed sea state. The waves normally come from the live forecast. Set the height, period and direction yourself instead, for a "what would a 6 m sea look like here" view. Today's map uses one fixed storm sea, typical of the open water that evening.
- Vessels that float. A vehicle tracking layer that draws its vehicles as 3D models can float them on the sea. Each vessel rises, pitches and rolls with the water under its hull, with a wake, a bow wave, a shadow and a reflection. How much it moves comes from its own length and beam, so a 200 m ferry barely stirs in a sea that throws a 50 m boat about.
- Clouds over the sea. The map's clouds now drift over the data, so the ferries sail under them and their shadows cross the water. They show from above as well as from below, so the camera can drop down through them to a ferry, and as you zoom out they drift faster, like a time-lapse, so the sky is always seen to move.
- Ferries in the catalog. Three new detailed ship models in the Icon Map Catalog: a cross-Channel ro-pax ferry, an Irish Sea freight ferry and a small island car ferry.
The land is the Europe aerial imagery layer from the catalog, so the ferries leave real harbors.
How accurate is it?
This is a picture of a storm, not a record of one. The scores come from the wave model's estimate of the sea that evening, not from measurements at sea, and use one hour for the whole of a crossing that can take many.
The sea drawn on the map is one fixed storm sea everywhere. It is a realistic sea with those statistics, not the actual waves that night, and the sheltered crossings show the same sea as the open ones.
The clouds and the sun are there for the look of the scene. They are not the storm's real cloud, and the sun is fixed at midday on the 21st, while the scores are for 21:00 that evening.
The ship model is simple: three damped springs for heave, pitch and roll, with no stabilizers and no change of speed or course for the weather. Roll is drawn on the map but not counted in the score. The standard weights motion by frequency, and I use the unweighted value, so the scores lean high. And people differ a great deal.
The ferries and their tracks are illustrative. The lines are drawn through open water between the ports, not the operators' routes, and the ferry positions are not a timetable.
Finally, the map scores what it is like to be at sea, not whether you will get there. The Stena Estrid's crossing scores as lively on this map. What kept its passengers on board for ten extra hours was the wind at the port, which no seasickness score shows.
Credits
Waves: Open-Meteo marine API (historical wave model data, CC BY 4.0). Aerial imagery: the Icon Map Catalog Europe aerial imagery layer, from the national and regional mapping agencies of twelve countries, the Netherlands among them; satellite imagery where there is no aerial photo contains modified Copernicus Sentinel data 2025. Ferry models: Tekantis. The Storm Isha story: Afloat and The Irish News. Basemap © IconMap, © OpenStreetMap contributors.