

It's day 26 of the 30 Day Map Challenge, and today's theme is water.
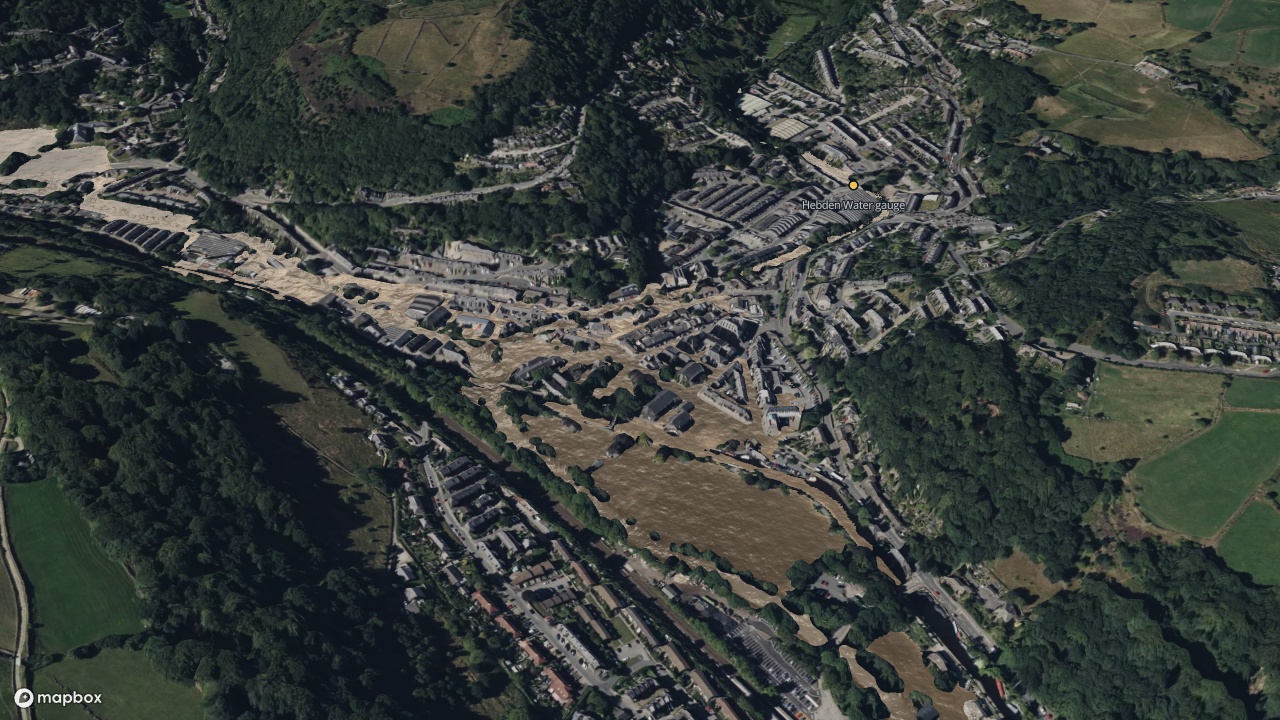
On 26 December 2015 the River Calder rose higher at Hebden Bridge than it had ever been recorded. Across Calderdale more than 2,000 homes and 1,000 businesses were flooded. Today's map replays that day in the town, hour by hour, with a flood model that runs inside the map.
Press play, or step through the four views along the top.
The water moves the way the model says it moved. Pale, rough water is fast water: it marks where the flood ran like a river down the streets. Darker, smooth water is standing or moving slowly. The clock on the slider is in UTC, which is local time in December.
Two rivers and a narrow valley
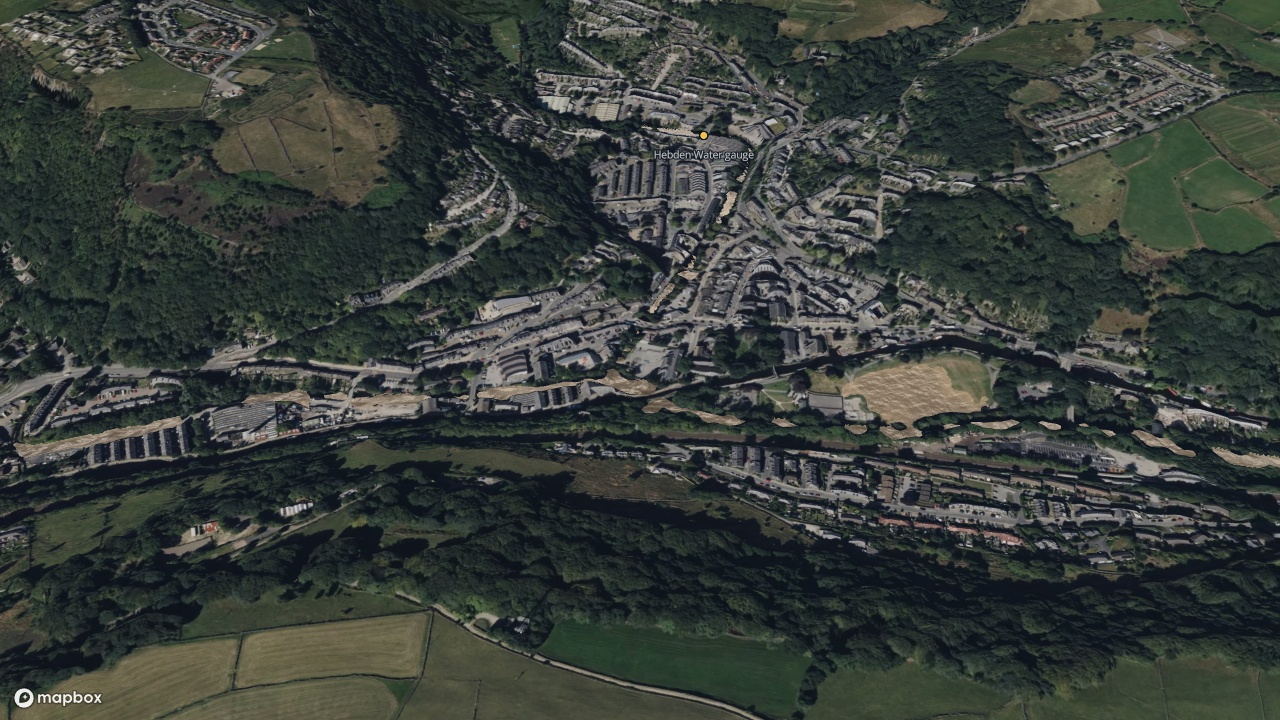
Hebden Bridge sits where Hebden Water, coming down from the moors to the north, meets the River Calder in a steep, narrow valley. There is very little flat ground, and the town is built on most of it. December 2015 had been exceptionally wet, so the ground was already full when a storm arrived on Christmas night. Both rivers rose together.
The day
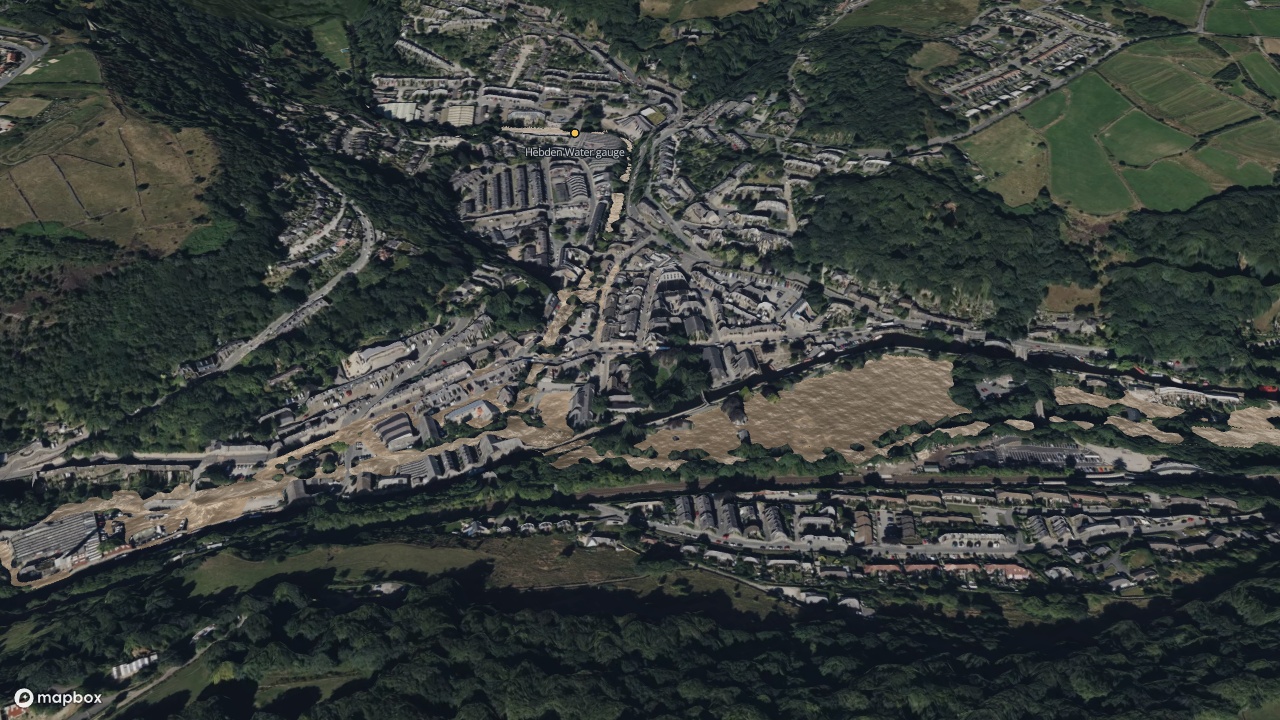
By mid-morning the Calder was over its banks. At 13:00 the Environment Agency's gauge in the town read 103.79 m above sea level, the highest level on its record.
How close is it?
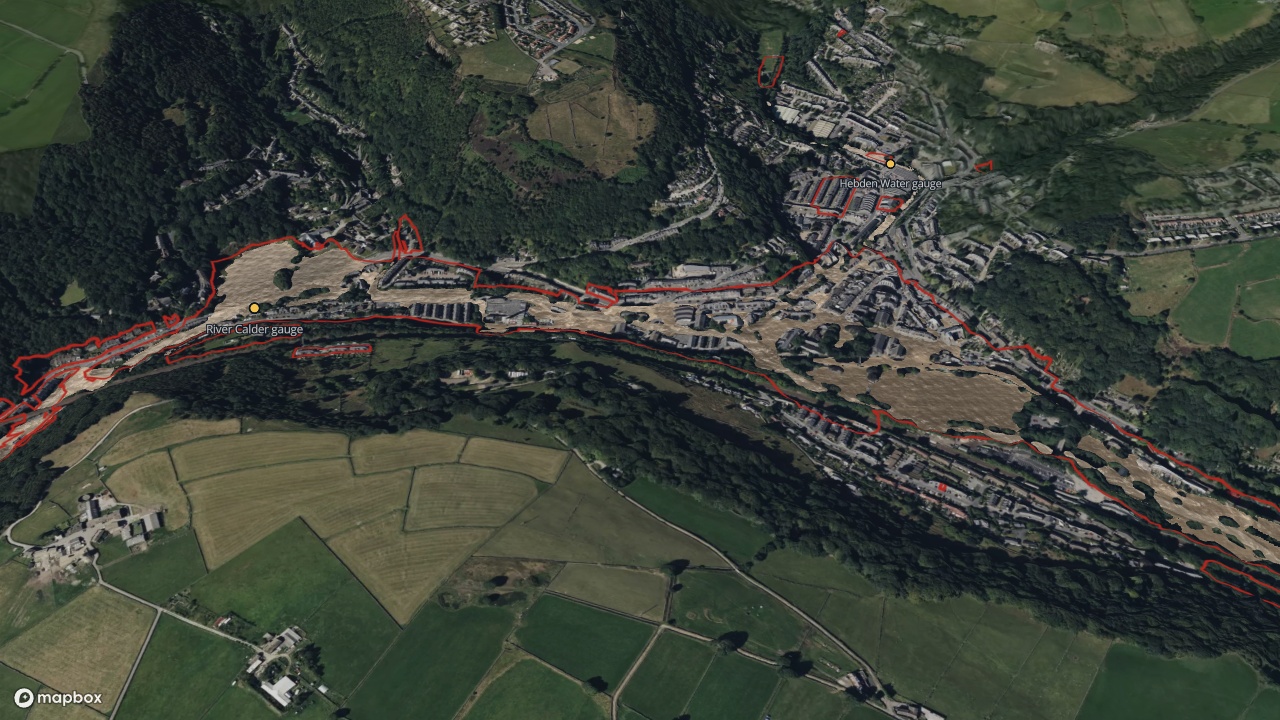
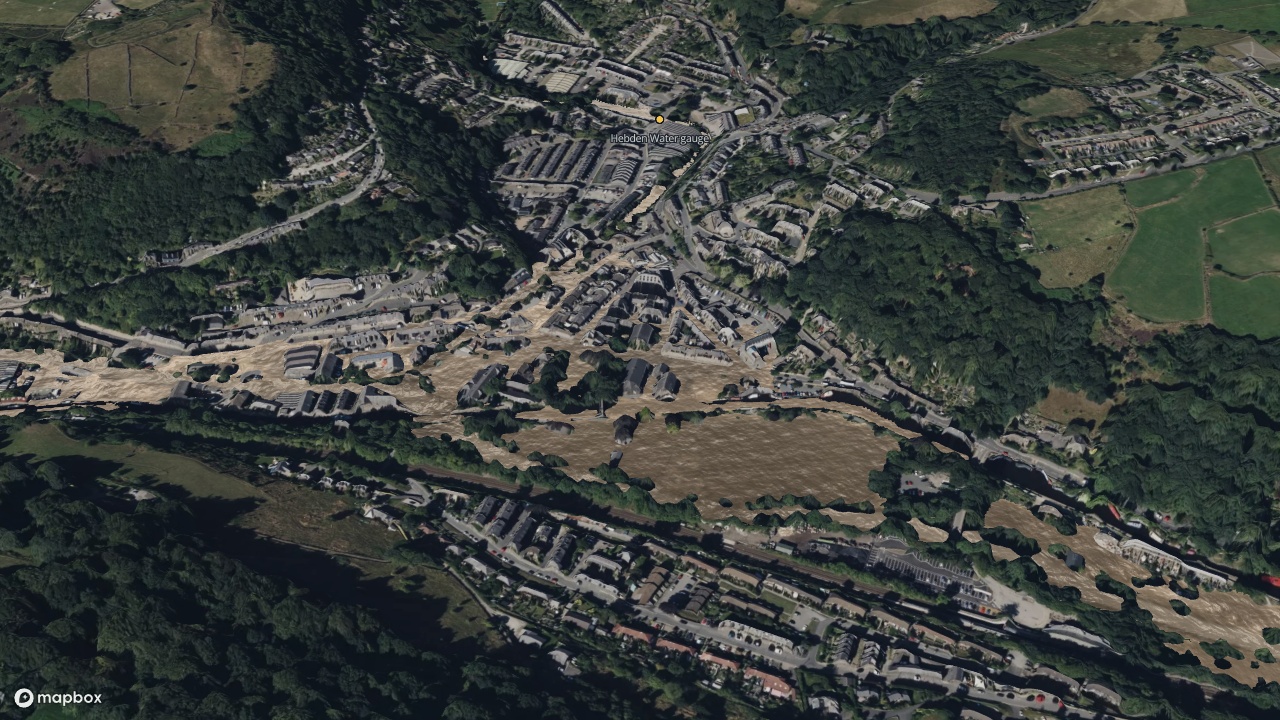
The red line is the flood the Environment Agency recorded that day. At the peak the model's water level is within half a meter of the gauge on the Calder, and within a few centimeters of the gauge on Hebden Water.
The model's water lies almost entirely inside the red line, and it does not fill it. It has only the two rivers in it, and it is not a forecast or an engineering study. More on what it leaves out below.
How did I build it?
The flood is a layer in Icon Map for Fabric. You give it the ground, the buildings and where the water comes in, and it works out where the water goes. It solves the shallow-water equations, the physics flood modeling is built on, on the graphics card in your browser. Here it runs on a grid of 900 by 555 cells, each a little over 2 m across, through 12 hours of the day.
The ground is 1 m lidar terrain from the Icon Map Catalog, which for England comes from the Environment Agency's survey. The buildings are from OpenStreetMap and act as walls the water has to go around.
The two rivers enter at the edges of the model as flows that rise and fall through the day. The shape of each rise comes from the Environment Agency's own record of the river level, measured every 15 minutes. How much water that means is not measured in the town, so I tuned the two peak flows, 160 cubic meters a second on the Calder and 68 on Hebden Water, until the model's levels matched the two gauges.
Three things are new in Icon Map for Fabric for this map:
- The water moves. The surface now carries the speed and direction the model gives each cell, so you can see a street running like a river next to a car park that is simply filling up.
- A published map carries the result. The model takes a couple of minutes to run. It runs once, when the map is built, and the result is stored with the published map, so the map above opens with the flood already in it.
- The water can run over a different ground from the one the map draws. A flood has to run over bare earth: water does not flow across rooftops or the tops of trees. The flood layer can now be given its own terrain, as other analysis layers already could.
The background is satellite imagery from Mapbox, draped over a 1 m surface model from the Icon Map Catalog. The surface model has the buildings and trees in it, so the town stands up out of the water. That is also why the third change above was needed: the map draws the surface model, and the flood runs over the bare ground underneath it.
How accurate is it?
It is a screening model. It shows where water of this size would go over this ground, and it leaves a lot out.
There are no drains, culverts or bridge decks in it. A bridge is a gap in the terrain the water runs straight through, and nothing takes water away below ground.
The river flows were tuned to make the levels at two gauges come out right. That makes the model good at the gauges and says less about everywhere else.
The terrain was surveyed years after the flood, so it includes whatever has changed in the valley since. In the river channels the survey recorded the water surface on the day it was flown, not the river bed.
The only water in the model is the two rivers. Water running off the hillsides, coming up through drains or arriving down smaller streams is not in it, which is part of why the model's flood is smaller than the one that was recorded. The recorded outline is itself drawn at a coarse scale, and in places it climbs the valley sides where the water plainly did not reach.
The satellite imagery was taken in summer, years later. It shows the town as it is now, not as it was that day.
Sources
Terrain: Icon Map Catalog, from the Environment Agency LIDAR Composite, Open Government Licence v3.0.
River levels and recorded flood outline: Environment Agency, Open Government Licence v3.0.
Buildings and river lines: OpenStreetMap contributors, from the Geofabrik extract for England.
Imagery: Mapbox, Maxar.
Homes and businesses flooded: Calderdale Council, one year on from the floods.