

It's day 25 of the 30 Day Map Challenge, and today's theme asks a question: is this a map? "Blend a map with art or creative visualization, testing where a map begins and ends."
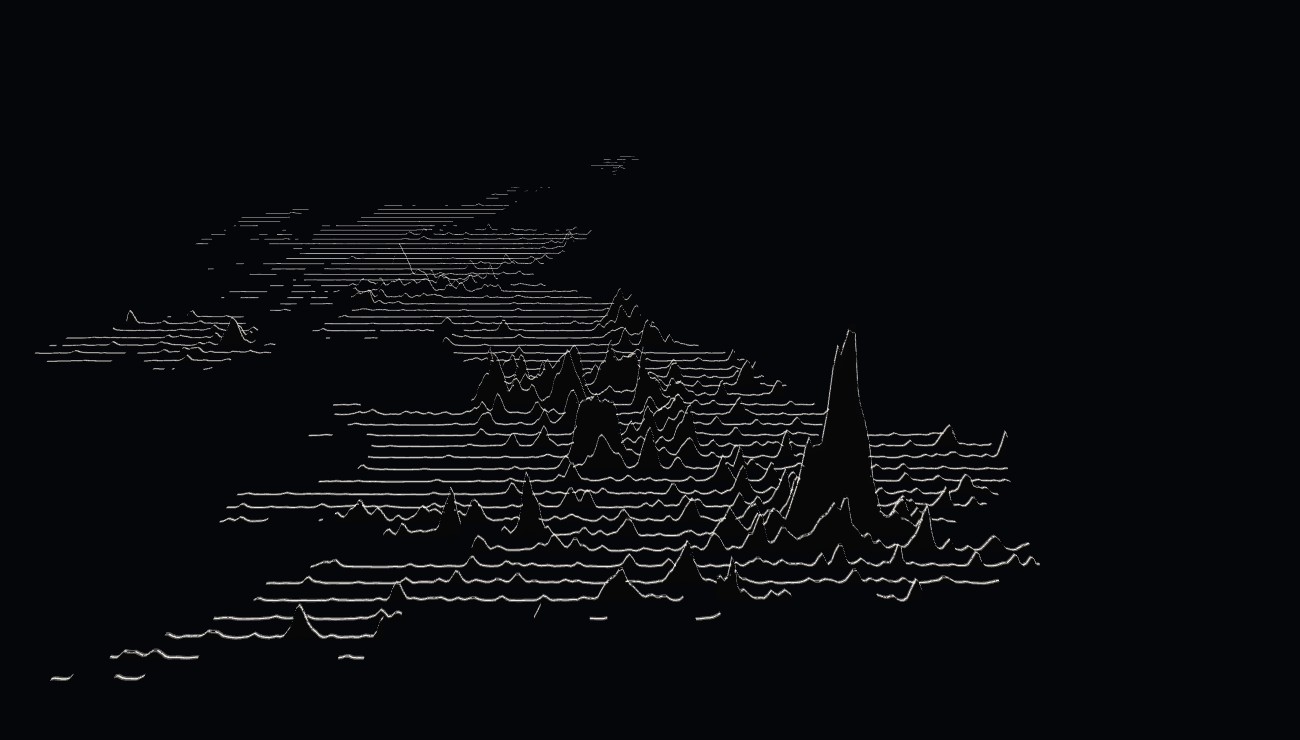
So here is a map with no geography on it. There's no coastline, no border, no road and no place name. There are just 65 lines crossing the UK from west to east, each one lifted by the number of people living along it. And yet you can tell exactly where you are: London is one tall peak, the cities of the north make a range across the Pennines, and Scotland's central belt is a low ridge with almost nothing beyond it.
The flat version
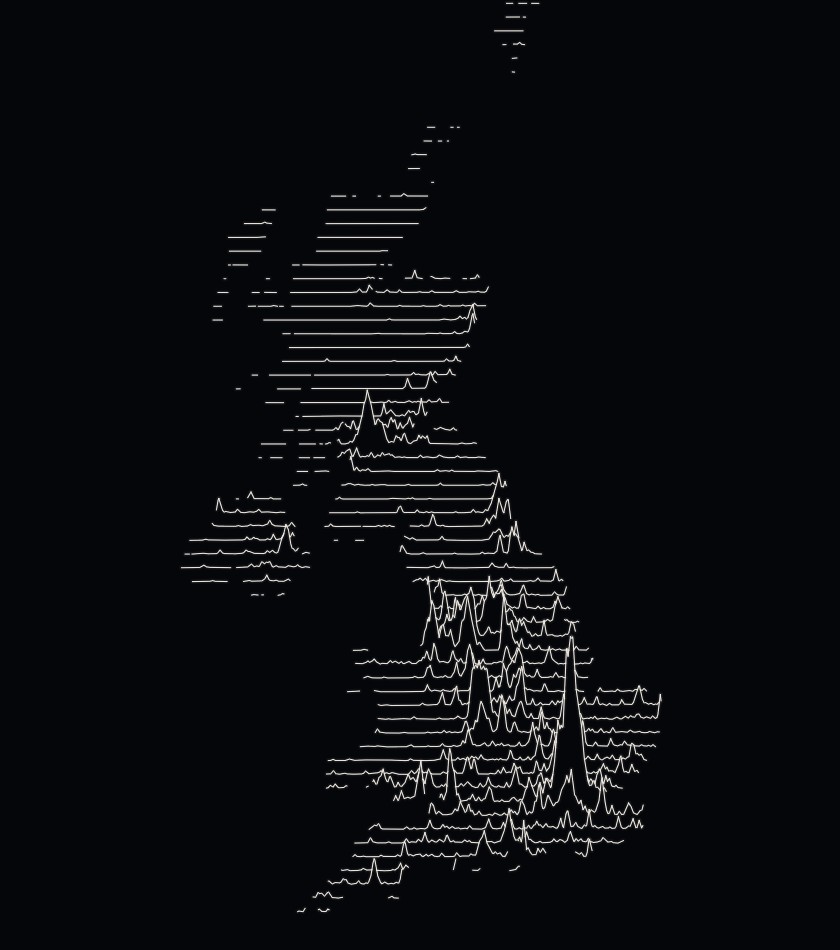
The first version is a ridgeline plot, a style many people know from the pulsar chart on the cover of Joy Division's Unknown Pleasures. Each line sits at its own latitude, and where people live it rises, so a busy line climbs up the page into the lines behind it. Like a mountain range seen from the south, each ridge hides the parts of the lines behind it that fall below it.
The 3D version
A ridgeline plot is a picture of a landscape, so I wondered what it would look like as a real one. Icon Map for Fabric can draw lines in 3D space, so in the second version each line stands at its true latitude and rises to a real height, as high as the number of people living along it. Under each line is a thin black wall, so the near ridges hide the far ones, just as they did on the flat page. Tilt it and the UK becomes a mountain range.
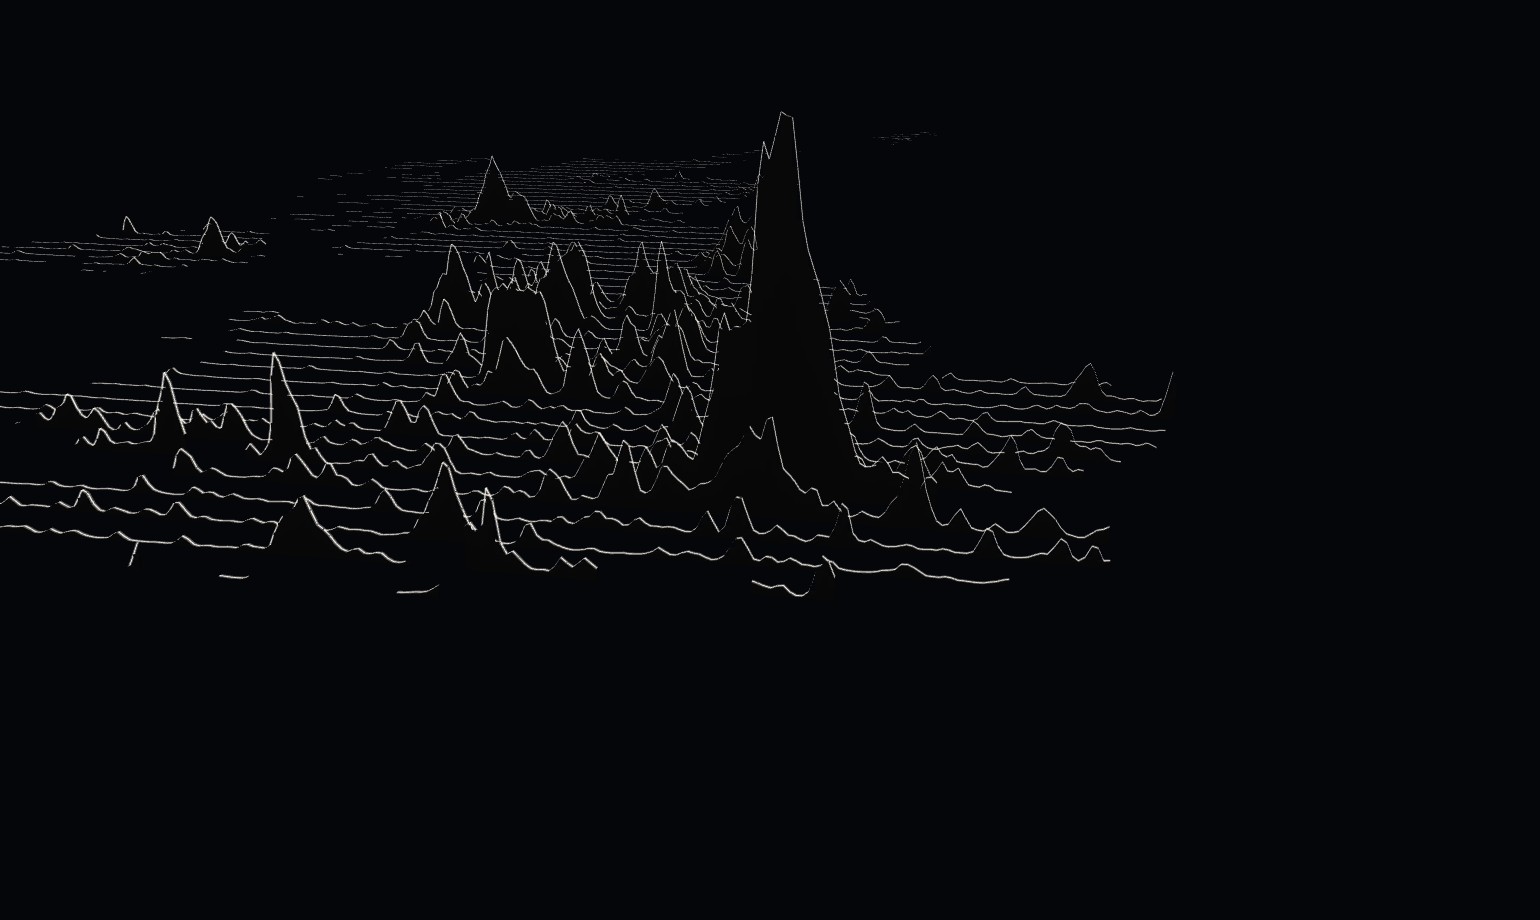
Use the bookmarks along the top to move around, or drag with the right mouse button to turn and tilt it. Hover over a line to see how many people live along it.
What the mountains say
The UK in this data has 63.6 million people. Half of them live on just 2.4% of the land.
The line through London carries 9.6 million people. That's more than ten times every line north of Pitlochry put together, which between them carry 870,000.
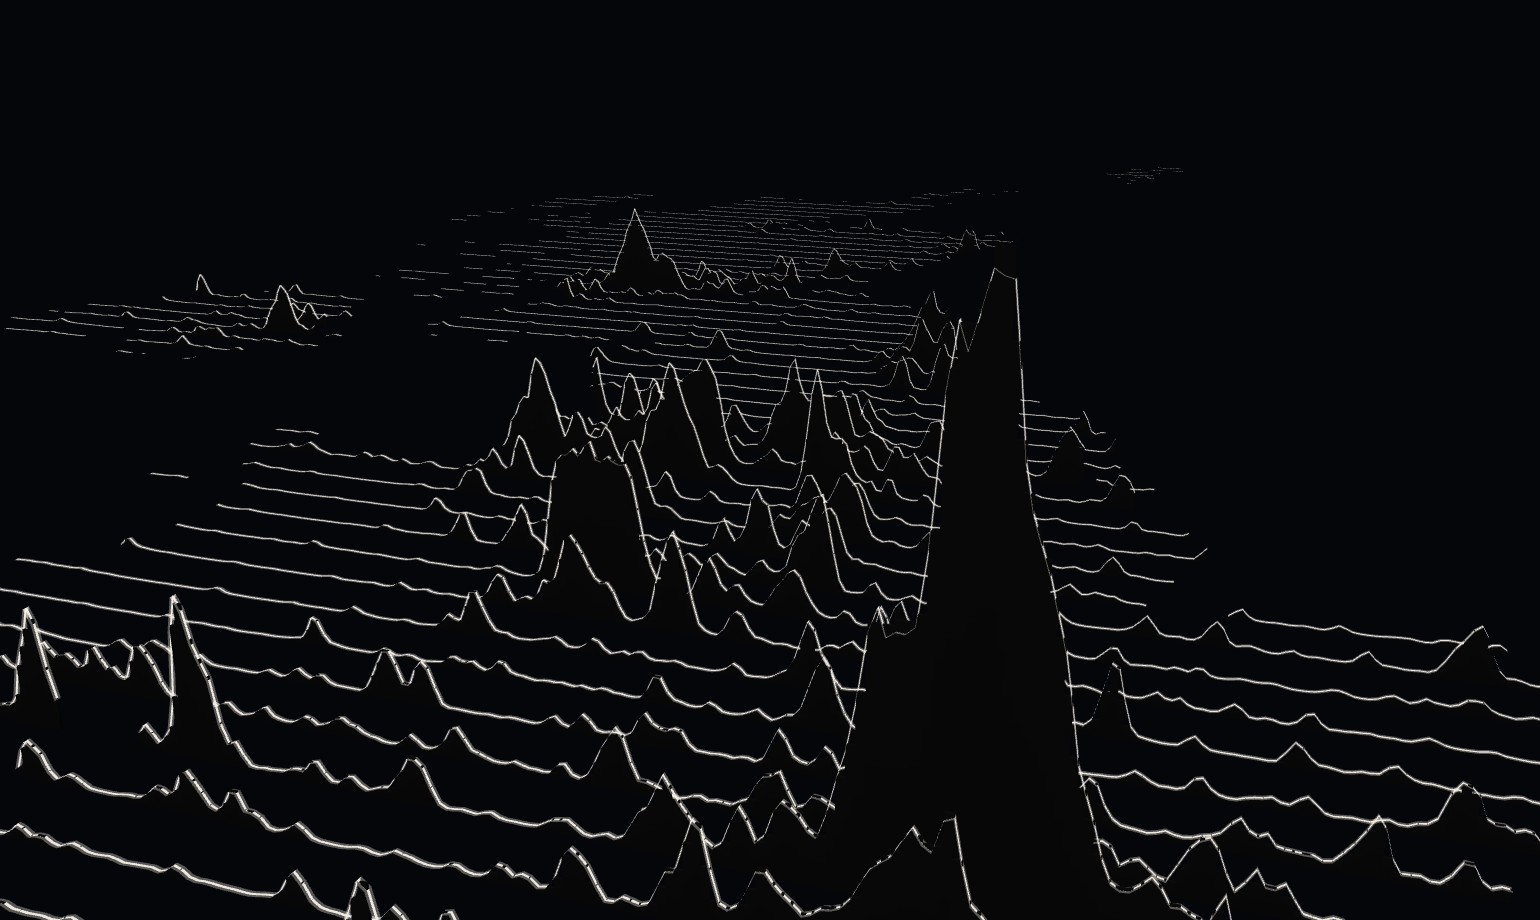
The north is a range, not a peak: Liverpool, Manchester, Leeds and Sheffield almost join up across the Pennines. Further north, Glasgow and Edinburgh make one low ridge across Scotland, and beyond them the lines run nearly flat all the way to Shetland.
How did I build it?
The population comes from Meta's Data for Good and Columbia University's CIESIN, who estimate where people live in 30 m squares by spreading census counts over the buildings they can see in satellite imagery. I added those up into squares about 1 km across.
Then I drew 70 lines from the Scilly Isles to Shetland, evenly spaced, and kept the parts that cross land: 65 lines in all. Each line is lifted by the average number of people per km² in its own strip of country, so the height of a line counts everyone between it and the next one. For the flat version I worked out which parts of each line a ridge in front would hide, and left them out.
In Icon Map for Fabric, the flat version is a lines layer on a black page. The 3D version is a lines layer drawn in 3D, with each point at its own height, over a geometry layer of thin black walls extruded to the same height.
How accurate is it?
It's a picture, not a measuring tool. There's no scale for the heights, and on the flat version each peak is drawn north of the place it measures.
The population is a modeled estimate for 2019. Its total for the UK is 63.6 million, a little below the official estimate for that year of about 66.8 million.
The 2.4% depends on the size of the squares: smaller squares would give a smaller share.
The data covers the UK only, so Northern Ireland stands alone, with no lines across the rest of Ireland.
Sources
Population: Meta Data for Good and CIESIN, Columbia University, High Resolution Population Density Maps, United Kingdom, 2019, on HDX under CC BY 4.0.
Land outline: Natural Earth, public domain.