

It's day 24 of the 30 Day Map Challenge, and today's theme is networks.
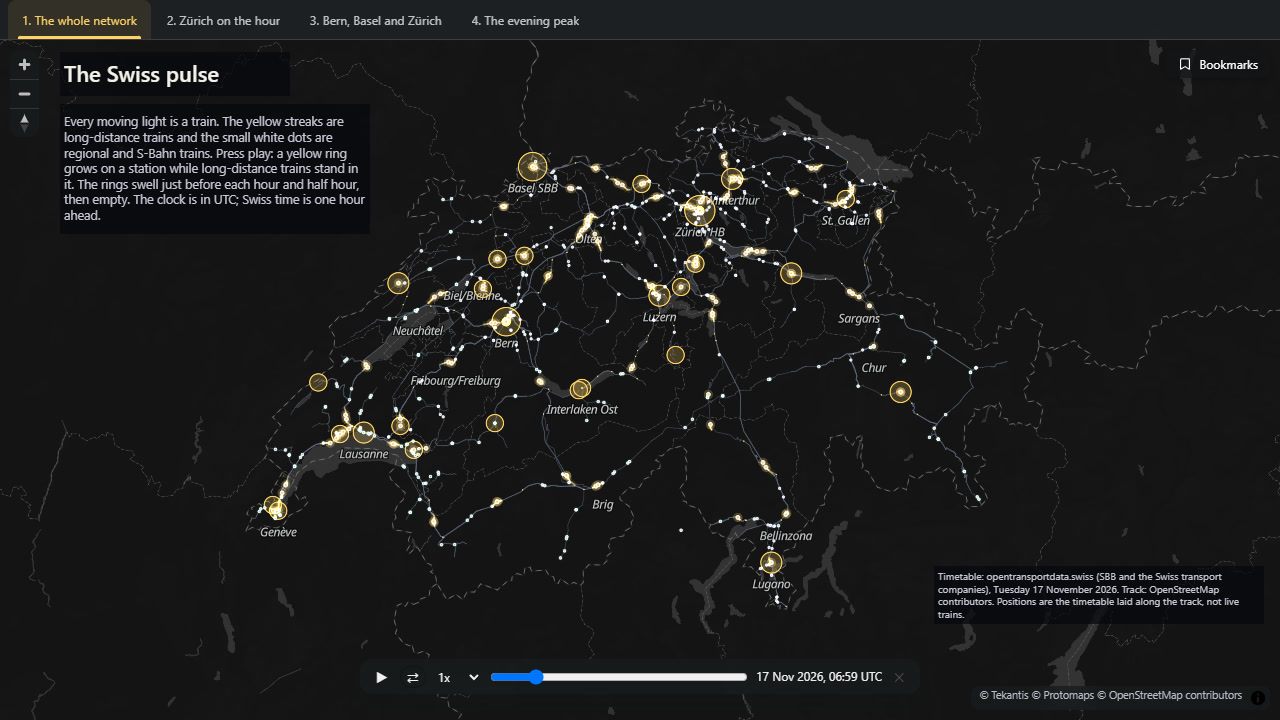
A rail network is usually drawn as lines. But the lines are only half of a network. The other half is the timetable, and Switzerland has the most famous one in the world. So today's map is every train in Switzerland through one day, and what it shows is the timetable's shape.
Press play and watch the yellow rings.
Every moving light is a train. The yellow streaks are long-distance trains, and the small white dots are regional and S-Bahn trains. A yellow ring grows on a station while long-distance trains are standing in it. The clock on the slider is in UTC; Swiss time is one hour ahead.
The pulse
Swiss trains run to a repeating pattern: the same trains leave at the same minutes past every hour, all day. More than that, the pattern is arranged so that at the main stations the long-distance trains from every direction arrive just before the hour and the half hour, stand together for a few minutes, and leave just after. You can change from any one of them to any other.
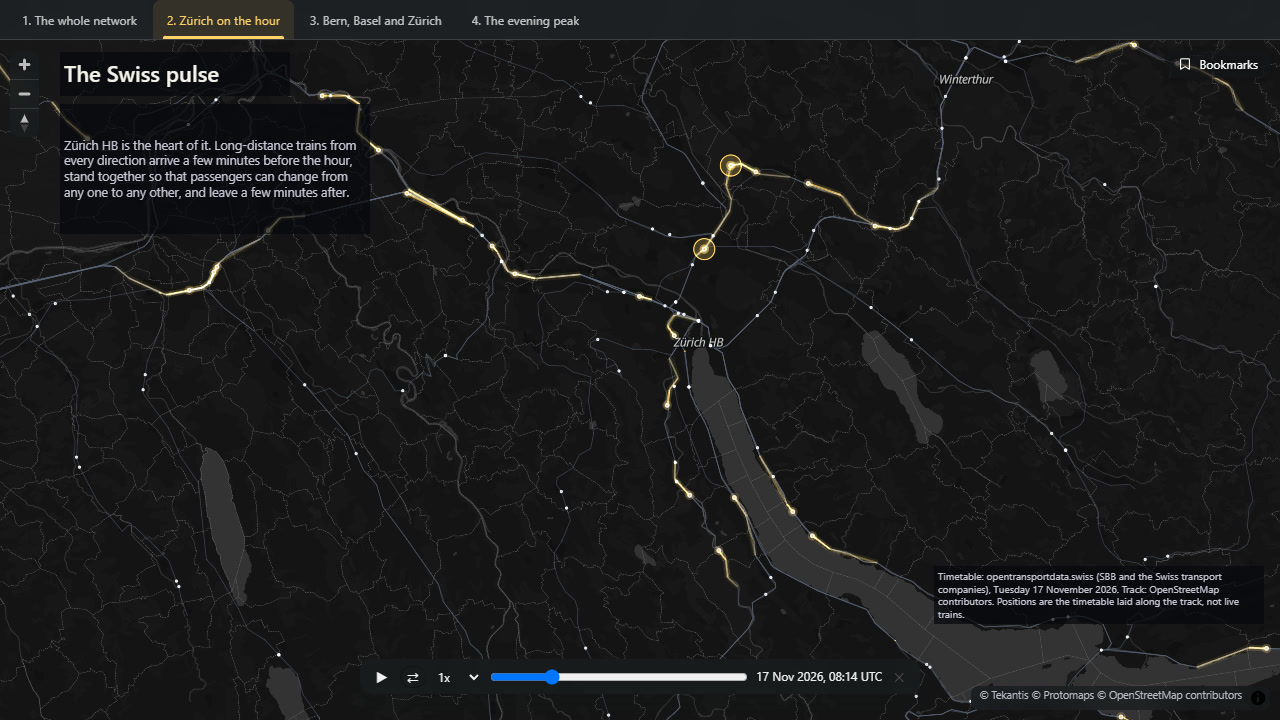
It shows up plainly in the numbers. At Zürich main station, between five in the morning and nine at night, there are on average 9 long-distance trains standing at the platforms at two minutes to the hour or half hour. A quarter of an hour later there are almost none.
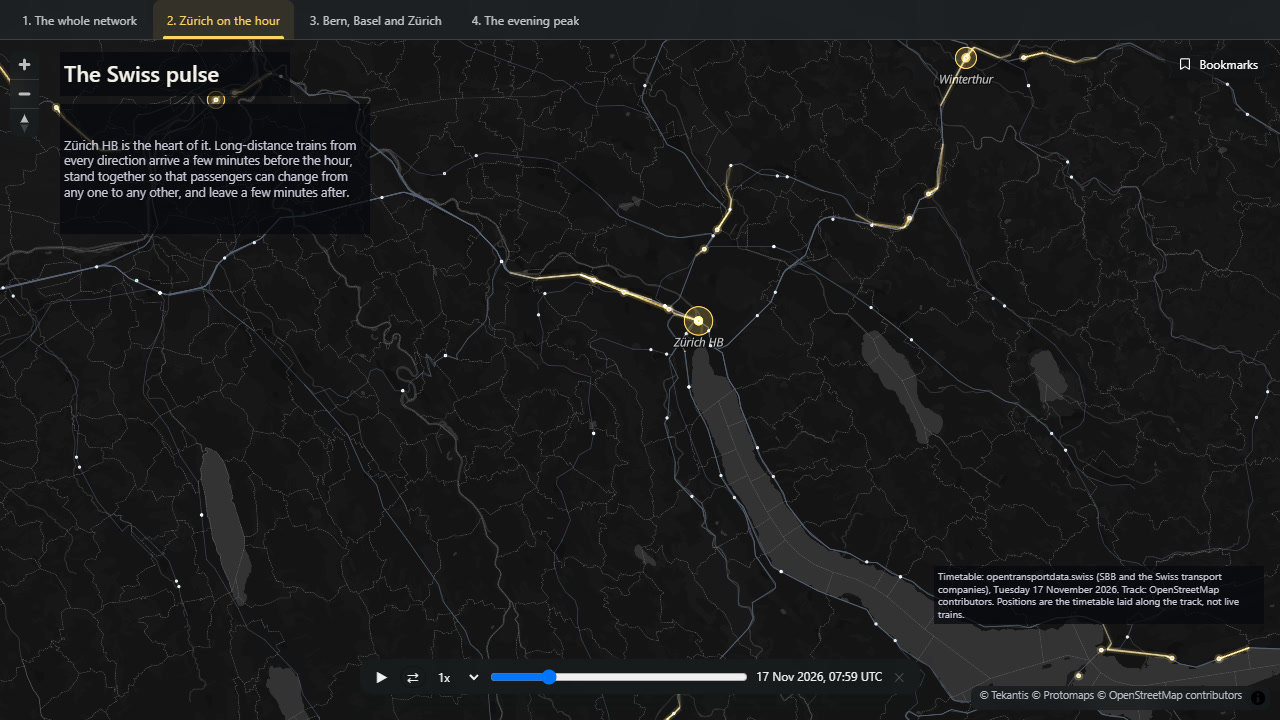
That's Zürich at one minute to nine, with the trains arriving. And this is the same view fifteen minutes later, with the station empty and the same trains fanning out:
Why it works
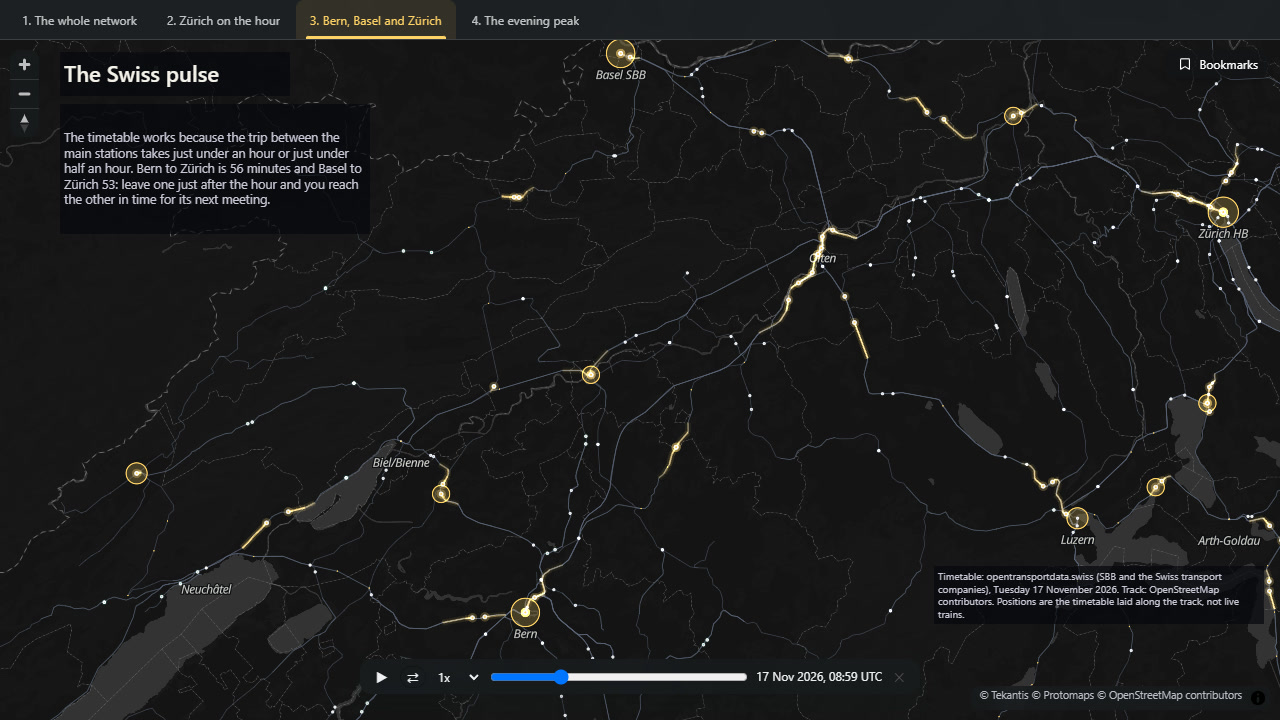
For trains to meet at every main station on the hour, the trip between two of them has to take a little under an hour, or a little under half an hour. In the timetable I used, Bern to Zürich takes 56 minutes and Basel to Zürich 53. Bern to Olten takes 26 or 27, and Basel to Olten 24 or 25. Leave one meeting just after the hour and you reach the next one just before it.
Switzerland has run this kind of timetable across the whole country since 1982, and has since built railway to fit the timetable, not the other way round: the new line between Bern and Olten opened in 2004 to bring Bern to Zürich under the hour.
The whole day
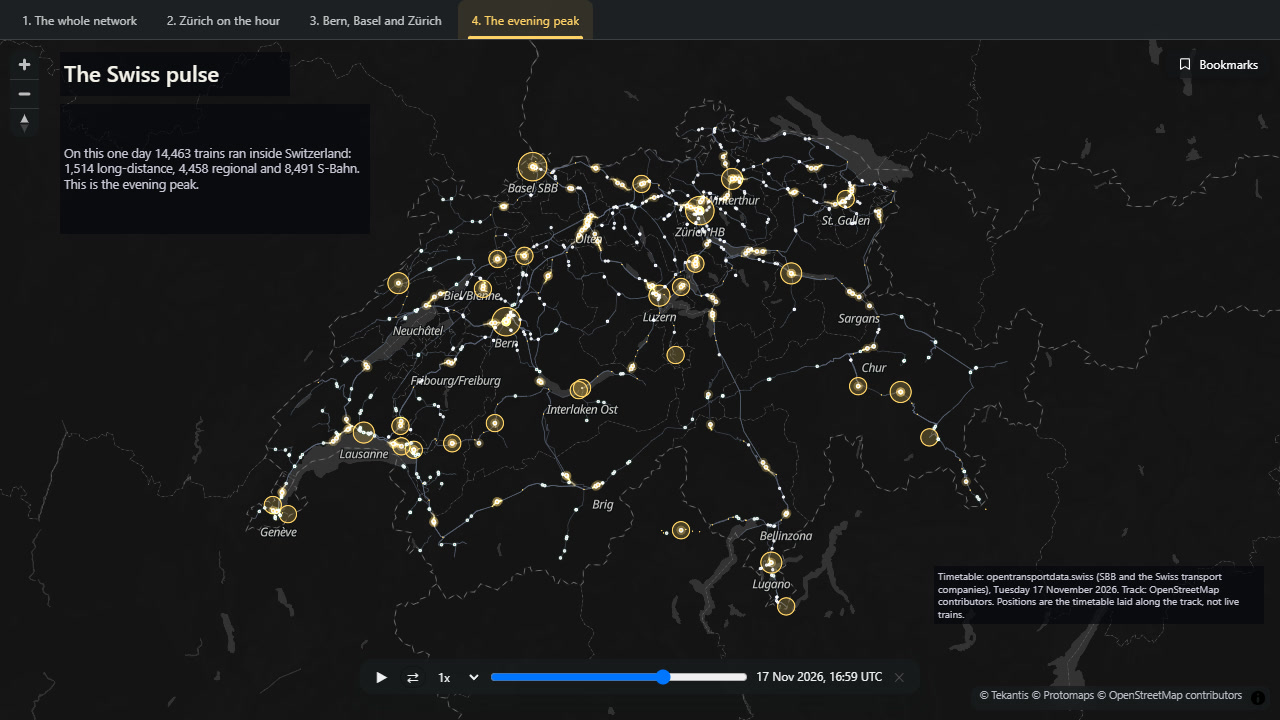
On the day I mapped, Tuesday 17 November 2026, 14,463 trains ran inside Switzerland: 1,514 long-distance, 4,458 regional and 8,491 S-Bahn.
How did I build it?
The timetable is the national one from opentransportdata.swiss, which covers every public transport company in the country. I took the trains for one day and kept the parts of their trips inside Switzerland.
A timetable says when a train leaves one station and when it reaches the next. It doesn't say where the track goes. So I took the railway lines from OpenStreetMap, joined them into a network of about 300,000 points, and for each pair of stations a train runs between, found the shortest way along the track. Each train's position is then spread along that track by time. That gave 460,000 positions for the day, stored as three small files in a Fabric lakehouse.
In Icon Map for Fabric the trains are a vehicle layer set to replay, which means the map's time slider moves them. It's the same layer that follows live vehicles; here it plays back a table. The rings are an ordinary circle layer reading a second table: one row each time the number of trains standing at a station changes. The layer is told which column is the time and which is the station, and the map then draws each station as it was at the slider's time.
To keep the map playing smoothly with more than 14,000 trains, only the long-distance trains draw a trail behind them.
How accurate is it?
This is the timetable, not the trains. It shows where each train should have been, not where it was.
Between two stops each train moves at a steady speed along the track. Real trains speed up, slow down and wait at signals.
The track each train follows is the shortest way between its stops, which is not always the way it really goes. Where an old line and a new line run between the same two stations, the map may have picked the wrong one.
For 56 of the 4,172 pairs of stations I couldn't find a way along the track, and those trains move in a straight line.
A ring counts a train from the minute it arrives to the minute it leaves. The timetable doesn't say how long a train stands at the station where it starts or ends its trip, so I've counted those for five minutes.
Trains are shown at their station's position, not at their platform, so trains standing together sit on top of each other. That is what the rings are for.
Parts of international trips outside Switzerland aren't shown.
Sources
Timetable: Open data platform mobility Switzerland, national timetable 2026 in GTFS format, published by SBB on behalf of the Swiss transport companies.
Track: OpenStreetMap contributors, from the Geofabrik extract for Switzerland.