

It's day 21 of the 30 Day Map Challenge, and today's theme is OpenStreetMap: "The awesome data source for mapping."
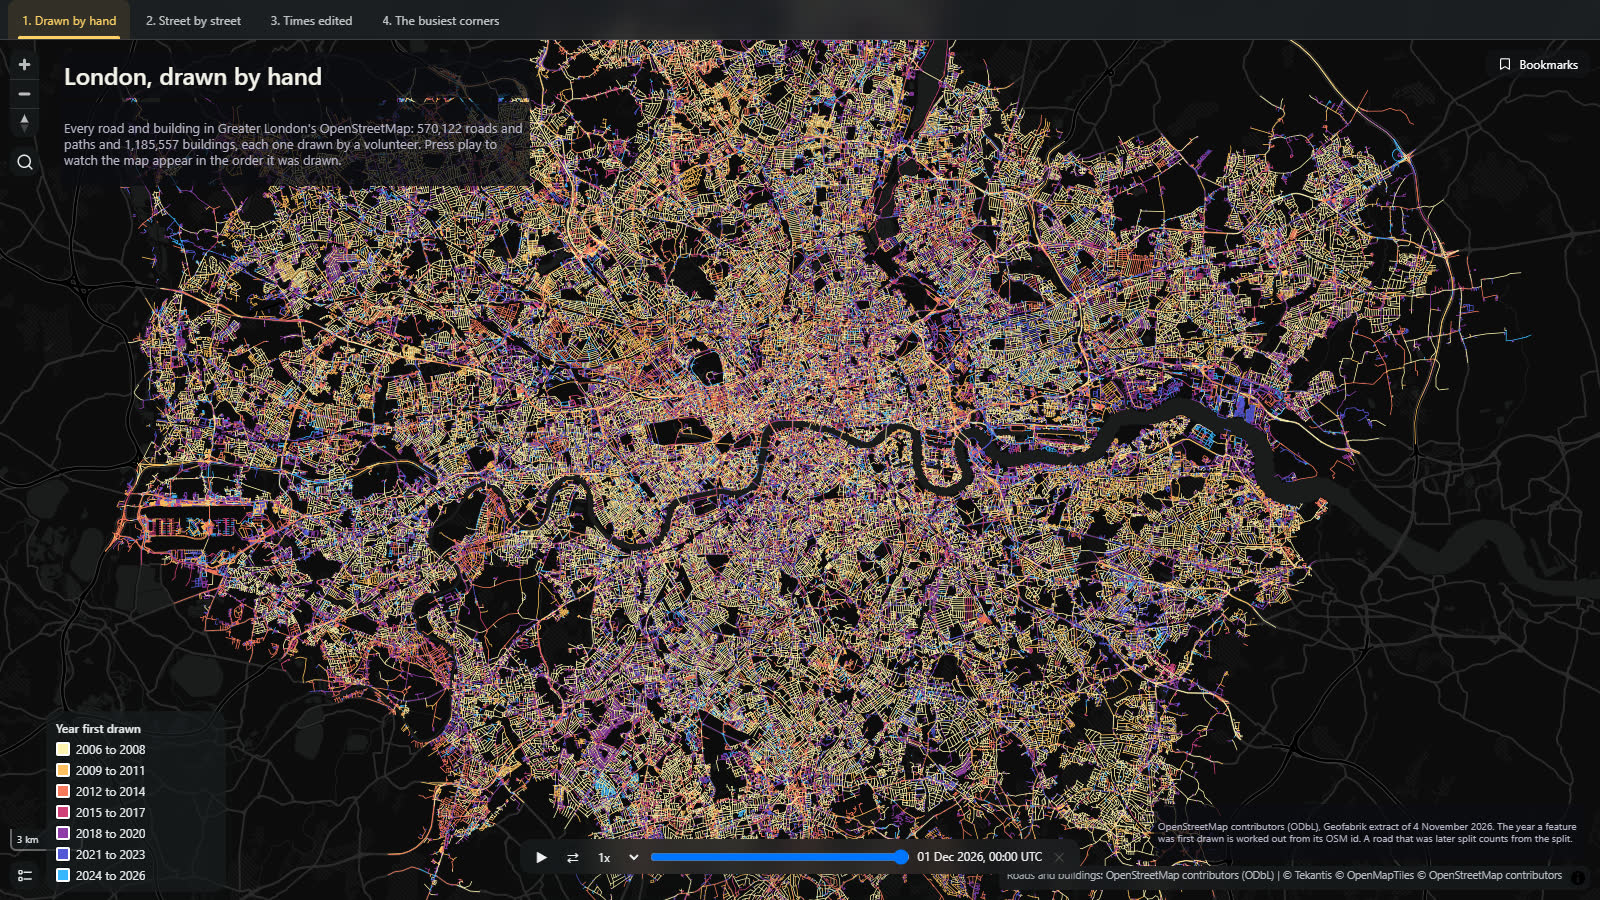
I've used OpenStreetMap as the data for a good few maps this month. Today I wanted to make a map of OpenStreetMap itself. Nobody surveyed it in one go. Volunteers drew it, one road and one building at a time, over twenty years. So this is London, where the project began in 2004, in the order it was drawn.
Press play on the time slider at the bottom and the map draws itself, from 2006 to this month. The bookmarks along the top take you to the other views.
Drawn by hand
The map holds 570,122 roads and paths and 1,185,557 buildings: everything OpenStreetMap has for Greater London under those two headings. Each one is colored by the year it was first drawn.
The streets came first. By the end of 2008, 12% of today's roads and paths were on the map, and almost none of the buildings: 0.3%. In those years you mapped a street by walking or cycling down it with a GPS, and nobody had time for the houses.
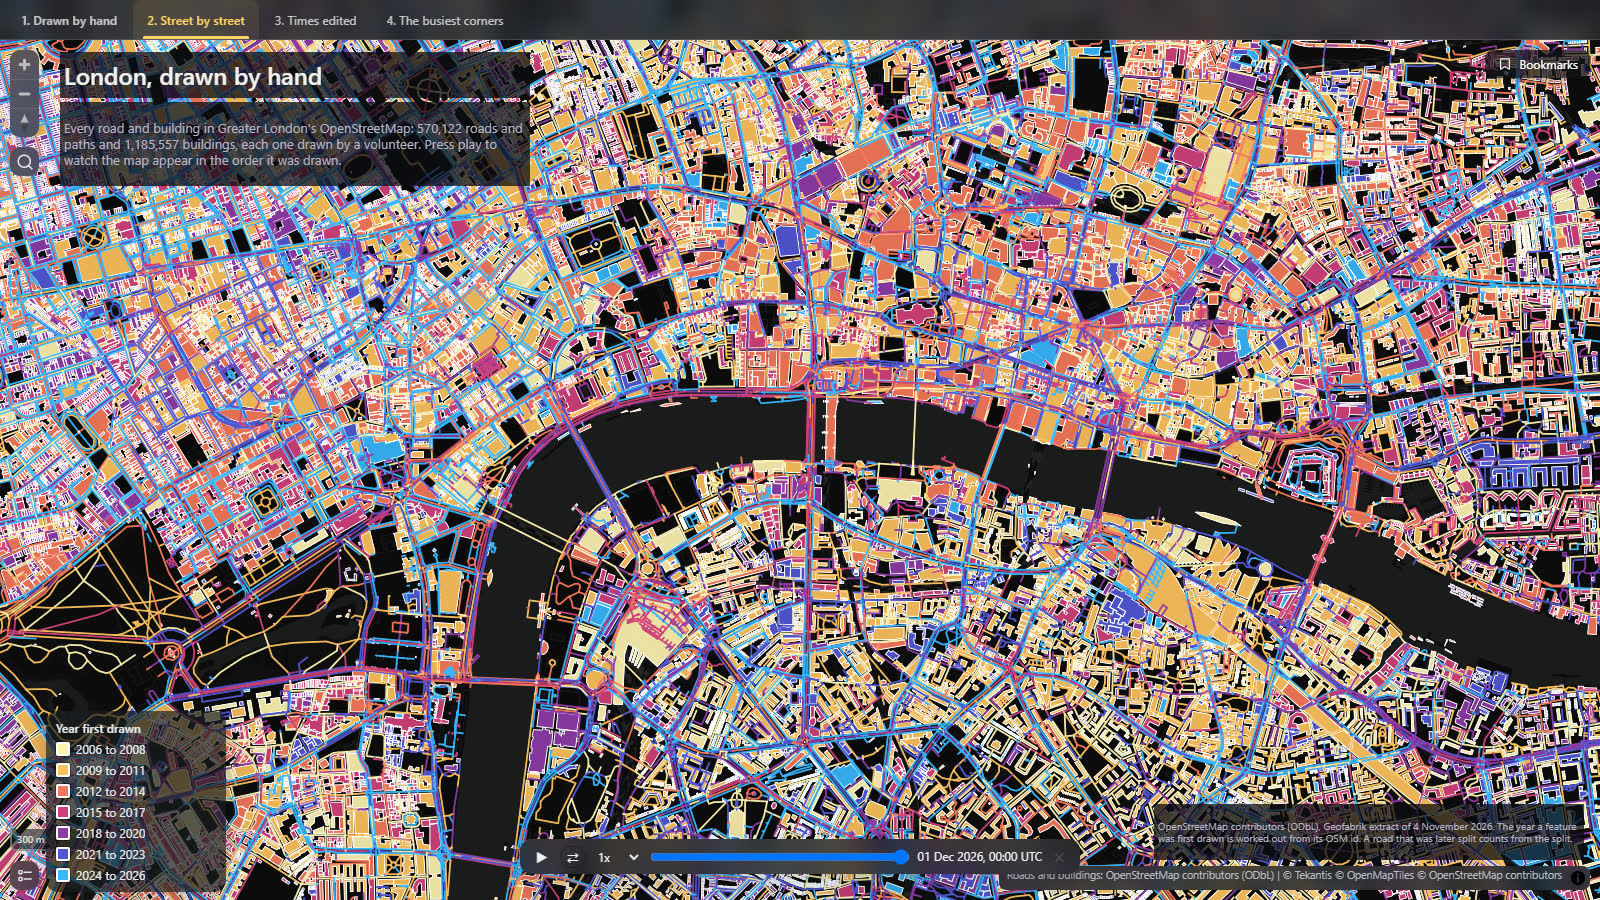
The buildings came later and they came in waves. Nearly half of London's buildings (46%) were drawn in the five years from 2019 to 2023. You can see it in the colors: gold and orange streets with purple and blue buildings filling in between them.
Times edited
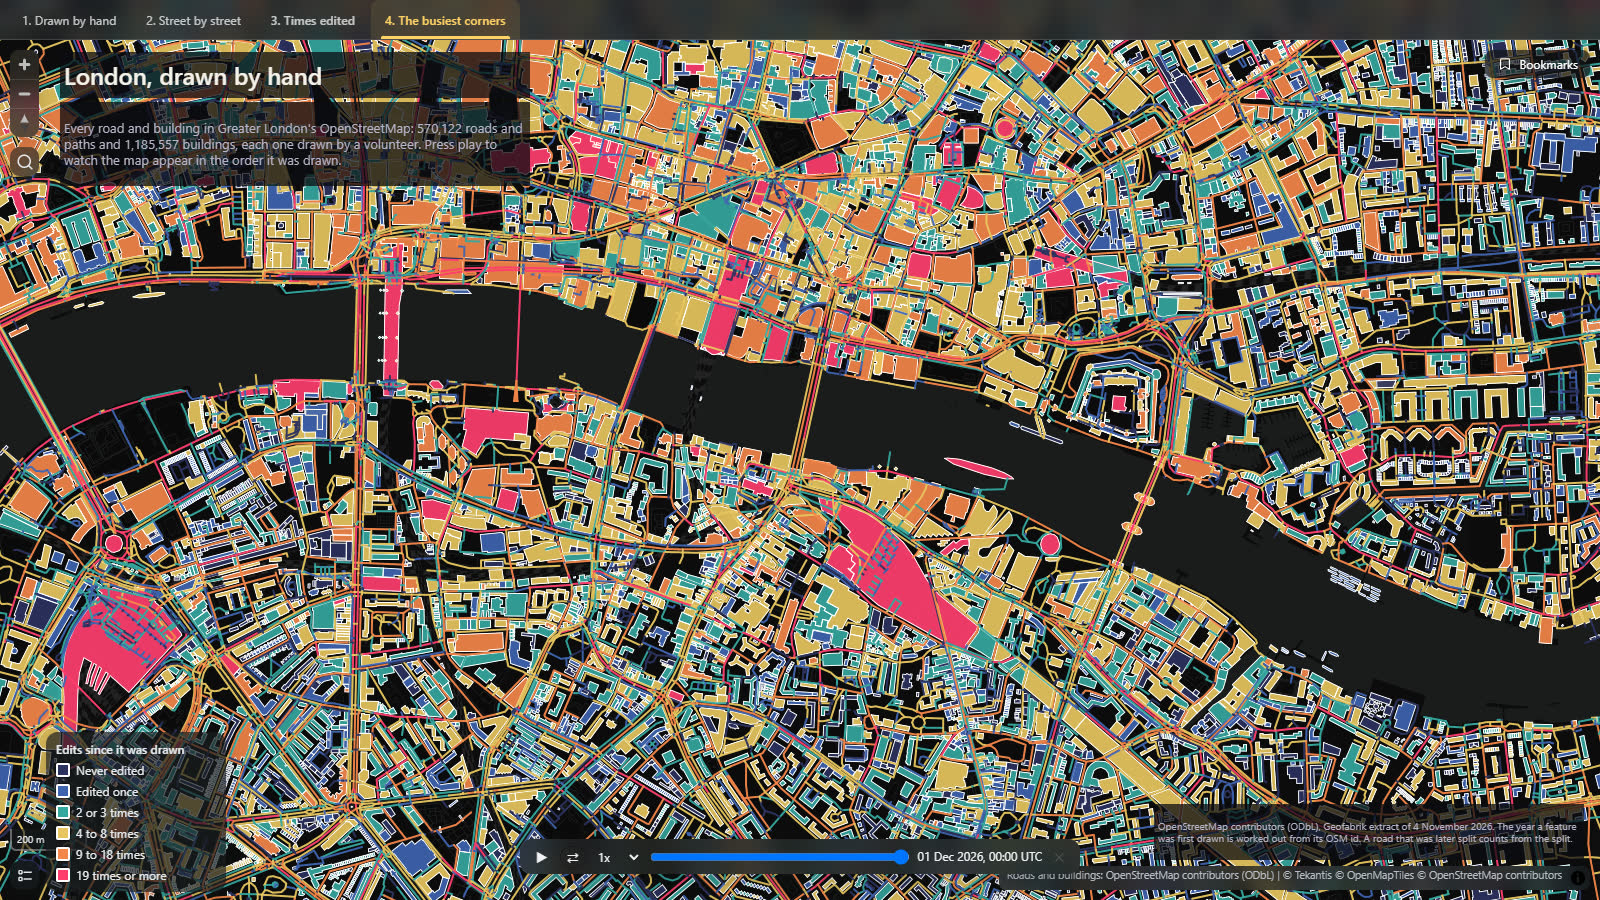
Drawing something is only the start. The other two bookmarks color the same roads and buildings by how many times they have been changed since.
About a third have never been touched: 35% of roads and 30% of buildings are exactly as they were first drawn. At the other end, 51,000 roads are on their tenth version or later. The main roads are the busy ones, because every new bus route, speed limit, cycle lane and turn restriction is an edit to the road it runs along.
The most edited thing in London is Barking Road in the east, now on its 131st version. Tate Modern is next, on its 99th. Then Westminster Abbey, Tower Bridge and Commercial Road, all on their 74th, and Waterloo Station on its 73rd.
How did I build it?
The data is the Greater London extract of OpenStreetMap from Geofabrik. That file holds the current version of everything: for each road and building, its version number and the date of that version. I turned the roads and buildings into one set of vector tiles and put the file in a Fabric lakehouse, and Icon Map for Fabric reads the tiles straight from there. It's the right tool for 1.75 million shapes: the map only ever loads the part you're looking at.
The file doesn't say when each thing was first drawn, only when it was last changed. But OpenStreetMap hands out its ids in order, so an id tells you roughly when its owner was created. About a third of the file has never been edited, and for those the date in the file is the date they were drawn. That gave me 866,721 points to work out a date for every other id.
The time slider is the same one Icon Map for Fabric uses for any data with a date in it. Here it's reading a date carried inside the tiles.
One thing was missing, so we added it. The legend printed the years as "2,009 - 2,012", with a comma, because it treated a year like any other number. Manual class breaks can now have your own labels, so the legend says "2009 to 2011", and the edits legend can say "Never edited" where it used to say "< 2".
How accurate is it?
The dates are when the feature you see today was created, and that isn't always when the street first appeared. When a mapper splits a road in two, to add a bus route to part of it or a new speed limit, one half keeps the old id and the other half gets a new one. So a street drawn in 2007 and split in 2024 shows as part gold and part blue. This affects busy central roads most, which is why so many of them look newer than they are. Buildings are rarely split, so their dates are more reliable.
The same goes for anything deleted and redrawn. It counts from the redraw.
The date worked out from an id is good to within days for most of the period. Before 2008 there are fewer untouched features to work from, so the earliest dates are rougher.
"Last edited" isn't on the map, although the data has it. More than half of London's roads and buildings were last touched in 2025 or 2026, so that map was mostly one color.
I've only counted roads, paths and buildings. Buildings stored as groups of shapes, which is how some large or complicated ones are mapped, are not included.
Sources
Roads and buildings: © OpenStreetMap contributors, from the Geofabrik Greater London extract of 4 November 2026.
Basemap: © OpenMapTiles © OpenStreetMap contributors.