

It's day 20 of the 30 Day Map Challenge, and today's theme is hexagons.
One of the most widely used hexagon grids in the world was built by a ride-hailing company. In 2018 Uber gave away H3, the grid it had built to work out prices and send drivers across a city. It covers the whole planet in hexagons, at sixteen sizes, from cells bigger than most countries down to about a square meter.
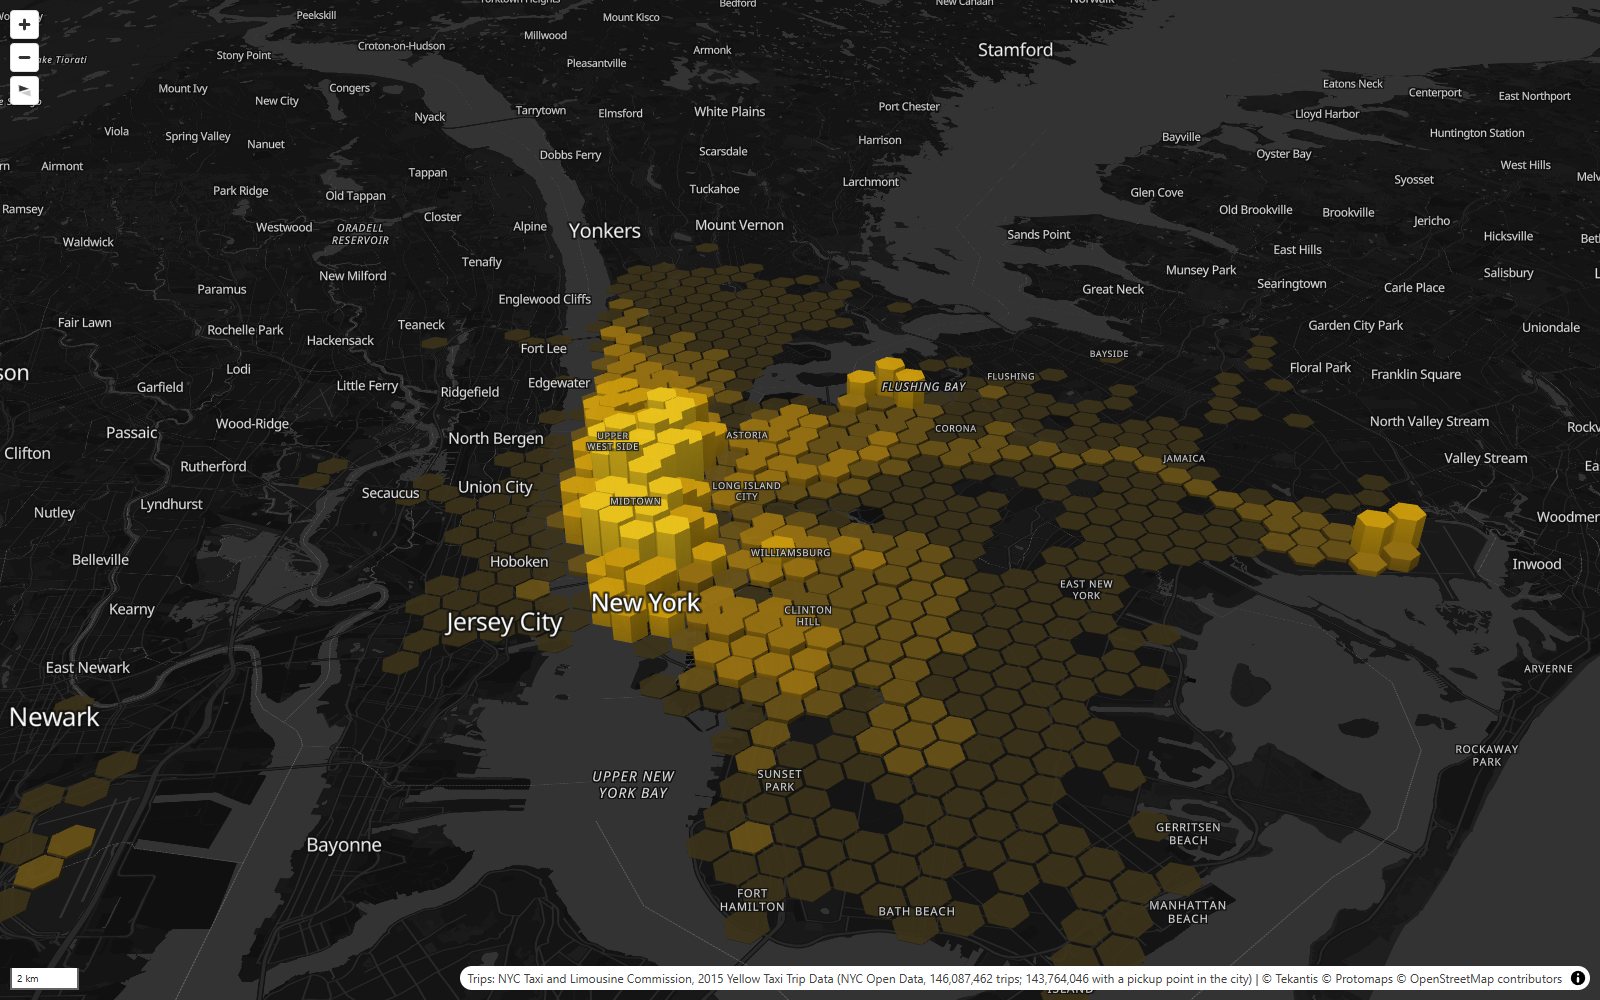
So it seemed only fair to fill it with taxis. Here is every yellow cab pickup in New York in 2015: 146 million trips, counted into H3.
Why hexagons? In a grid of squares, the cells next door aren't all the same: four share an edge and four only touch at a corner, further away. In hexagons every neighbor shares an edge and every neighbor's center is the same distance away. That makes a hexagon grid good at the questions a taxi company asks, like "where's busy near here?", because "near" means the same thing in every direction.
H3 is also a hierarchy. Each hexagon splits into seven smaller ones, and each of those into seven more. The map uses six of the sizes. Zoomed out, each cell is about 5 km². Zoom in and the cells split, and split again, down to about 300 m², a little bigger than a tennis court. The height of each column is pickups a day, and the color is pickups a day per km², so the colors mean the same thing at every zoom level. Use the bookmarks along the top to move around, and hover over any hexagon to see its numbers.
That's 143.8 million pickups with a usable location, or nearly 394,000 a day. They took $1.85 billion in fares and covered 428 million miles. Riders who paid by card tipped 20% on average.
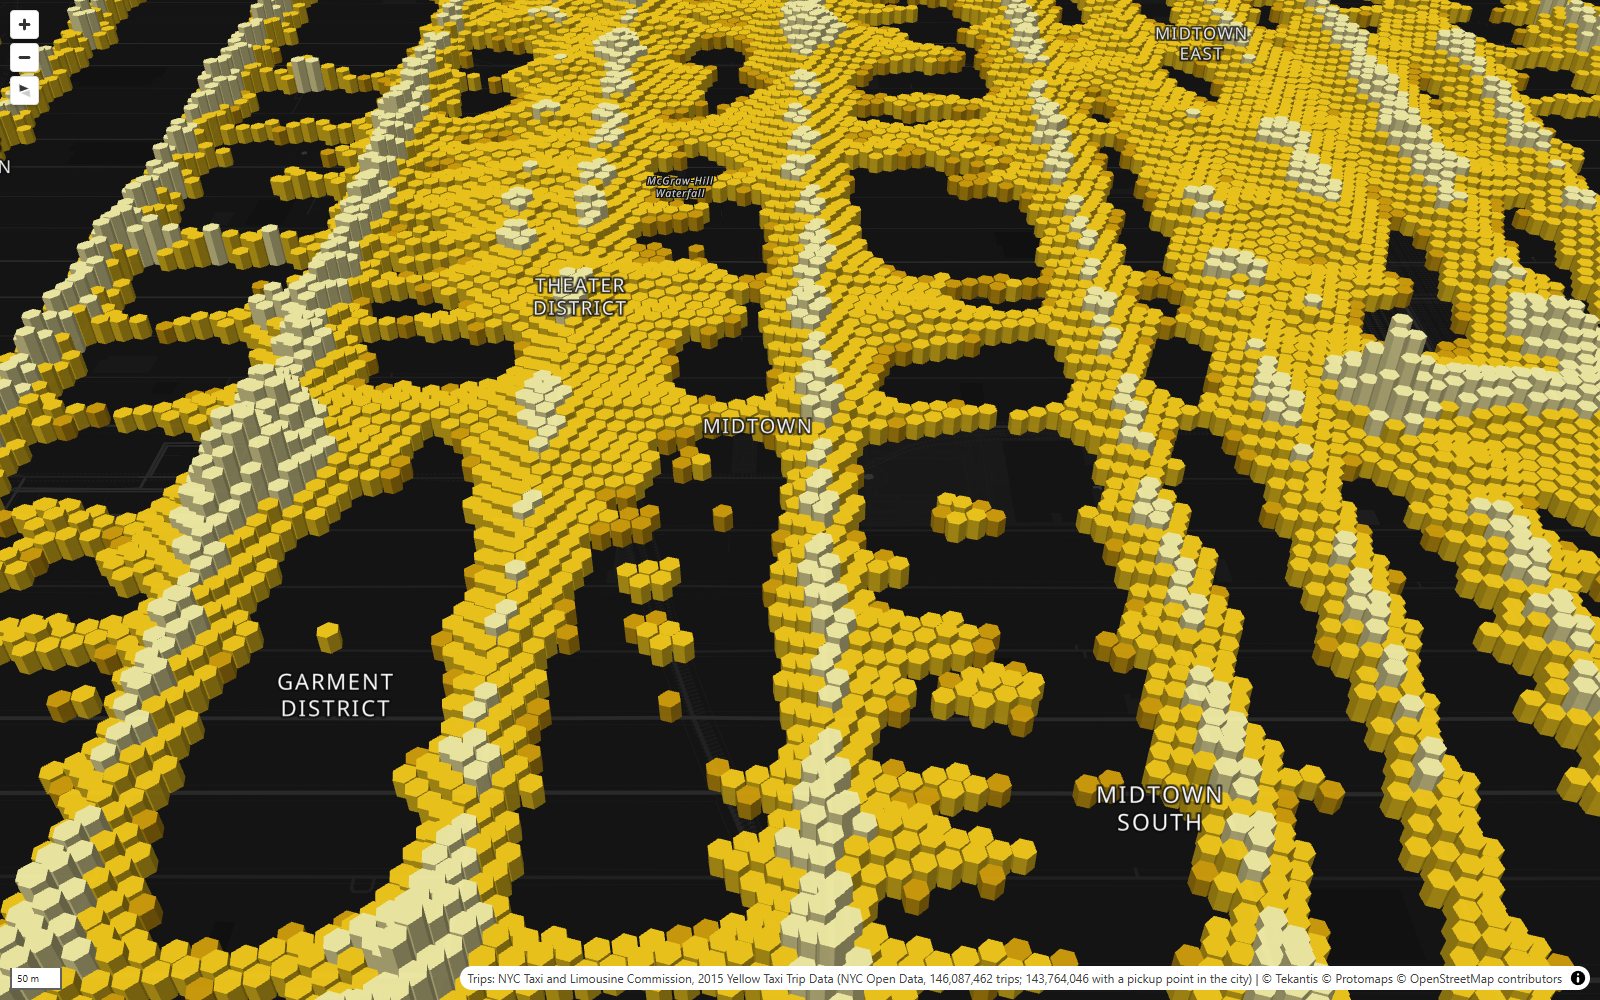
Zoom right in and the smallest cells draw the streets. Nobody told the map where the roads are. Cabs only stop on streets, so the pickups trace them: the avenues as bright lines, the cross streets fainter, and dark holes where the buildings are. The busiest of these tiny cells is on Eighth Avenue by Penn Station: 655 pickups a day, about one every two minutes, day and night, all year. A step up, the busiest of the 0.1 km² cells covers Penn Station itself, with more than 6,000 pickups a day.
Where riders went
The small map in the corner shows where people went. Click any hexagon and it shows the top destinations for trips that started in that neighborhood, and zooms to fit them. The thicker the line, the more trips. The busiest routes of all are short hops around Midtown. The busiest, from the Penn Station neighborhood to the blocks around Bryant Park, is barely a kilometer and was driven 576,000 times in the year.
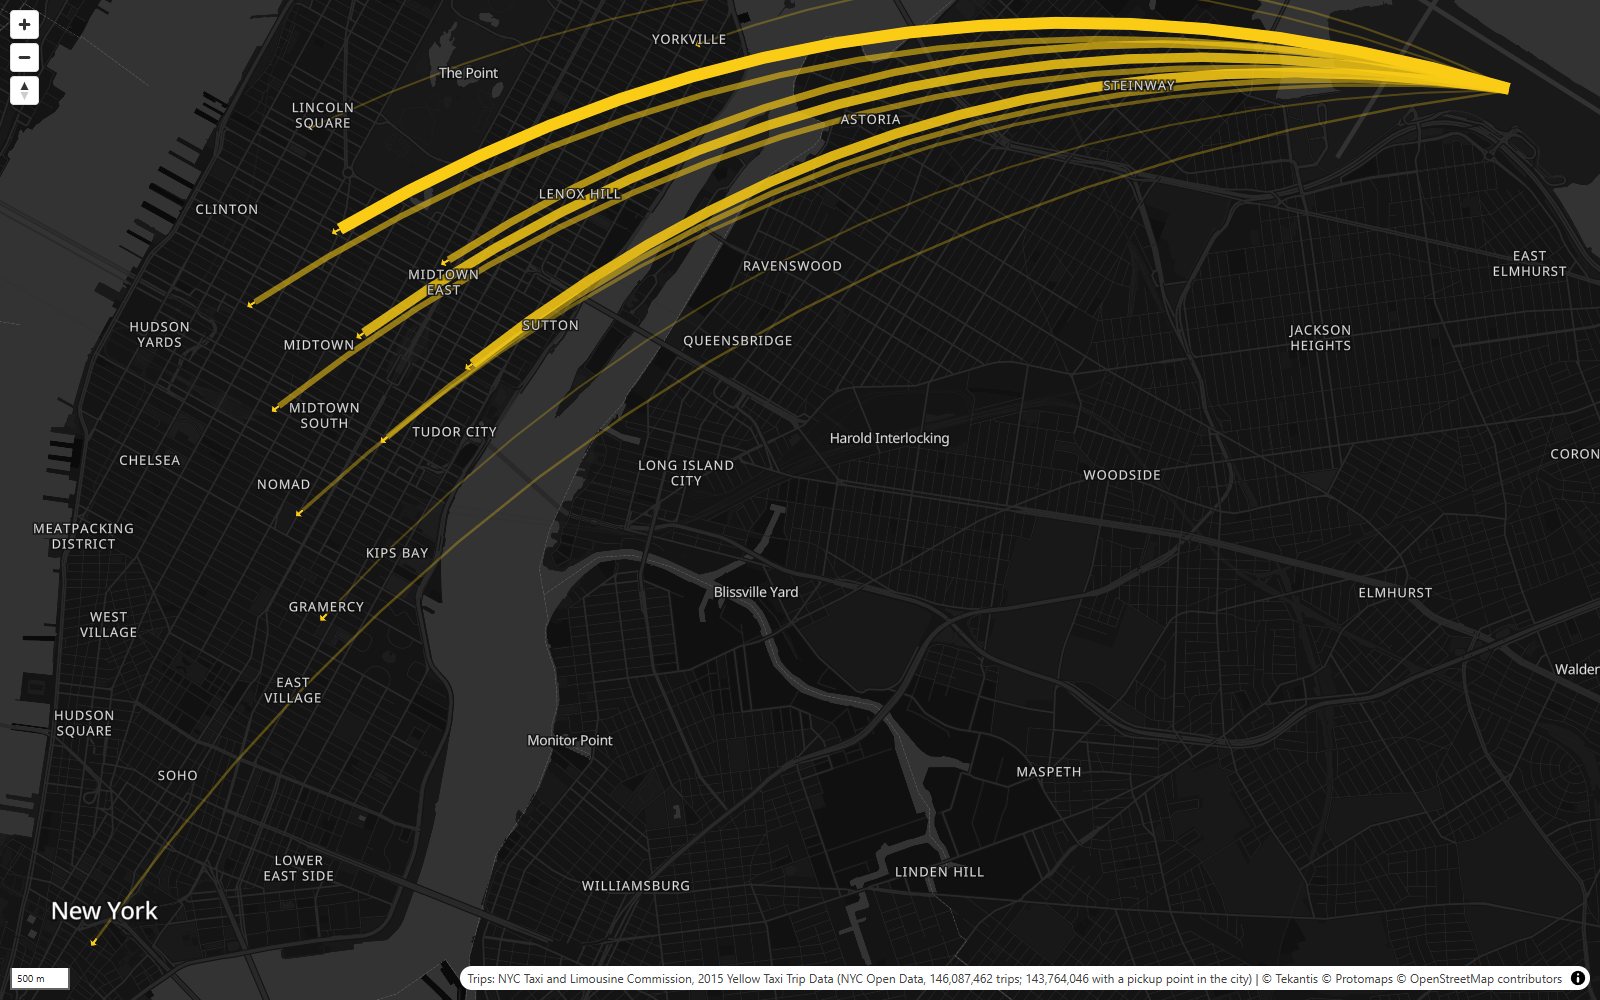
Riders leaving LaGuardia nearly all head the same way: into Midtown, the thickest lines ending in the blocks north of Times Square and in Midtown East.
A week in the life
The third bookmark switches to an average week, hour by hour, on the time slider. Press play and the city breathes.
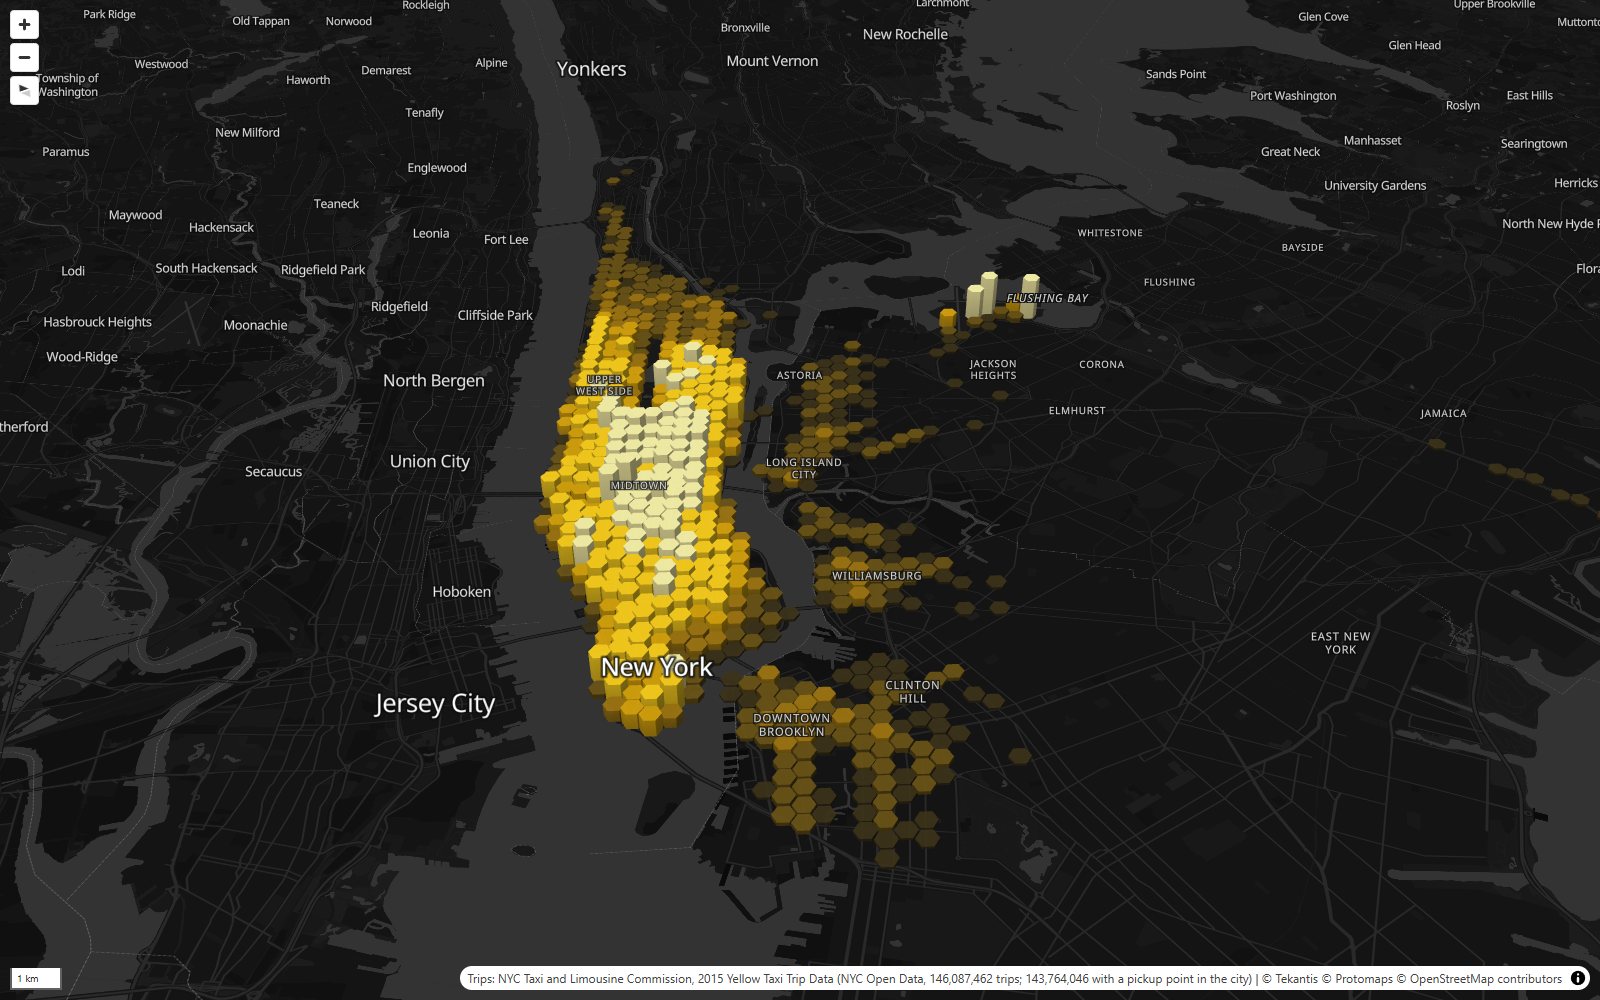
The busiest hour of the week is 7pm on a Friday, with more than 26,000 pickups. The quietest is 3am on a Tuesday, with about 2,100. Weekday evenings all peak around 7pm. Friday and Saturday nights just keep going: at 1am on a Saturday or Sunday morning there are three times as many pickups as at 1am on a weekday. On the Lower East Side, nearly two in every three pickups happen between 10pm and 5am.
The year has its moments too. The busiest day was Saturday 31 January, with 508,852 pickups. Four days earlier was the quietest, with 133,246. That was the blizzard of January 2015, when the city banned driving overnight and shut the subway. Christmas Day was the second quietest, with 185,914.
The airports
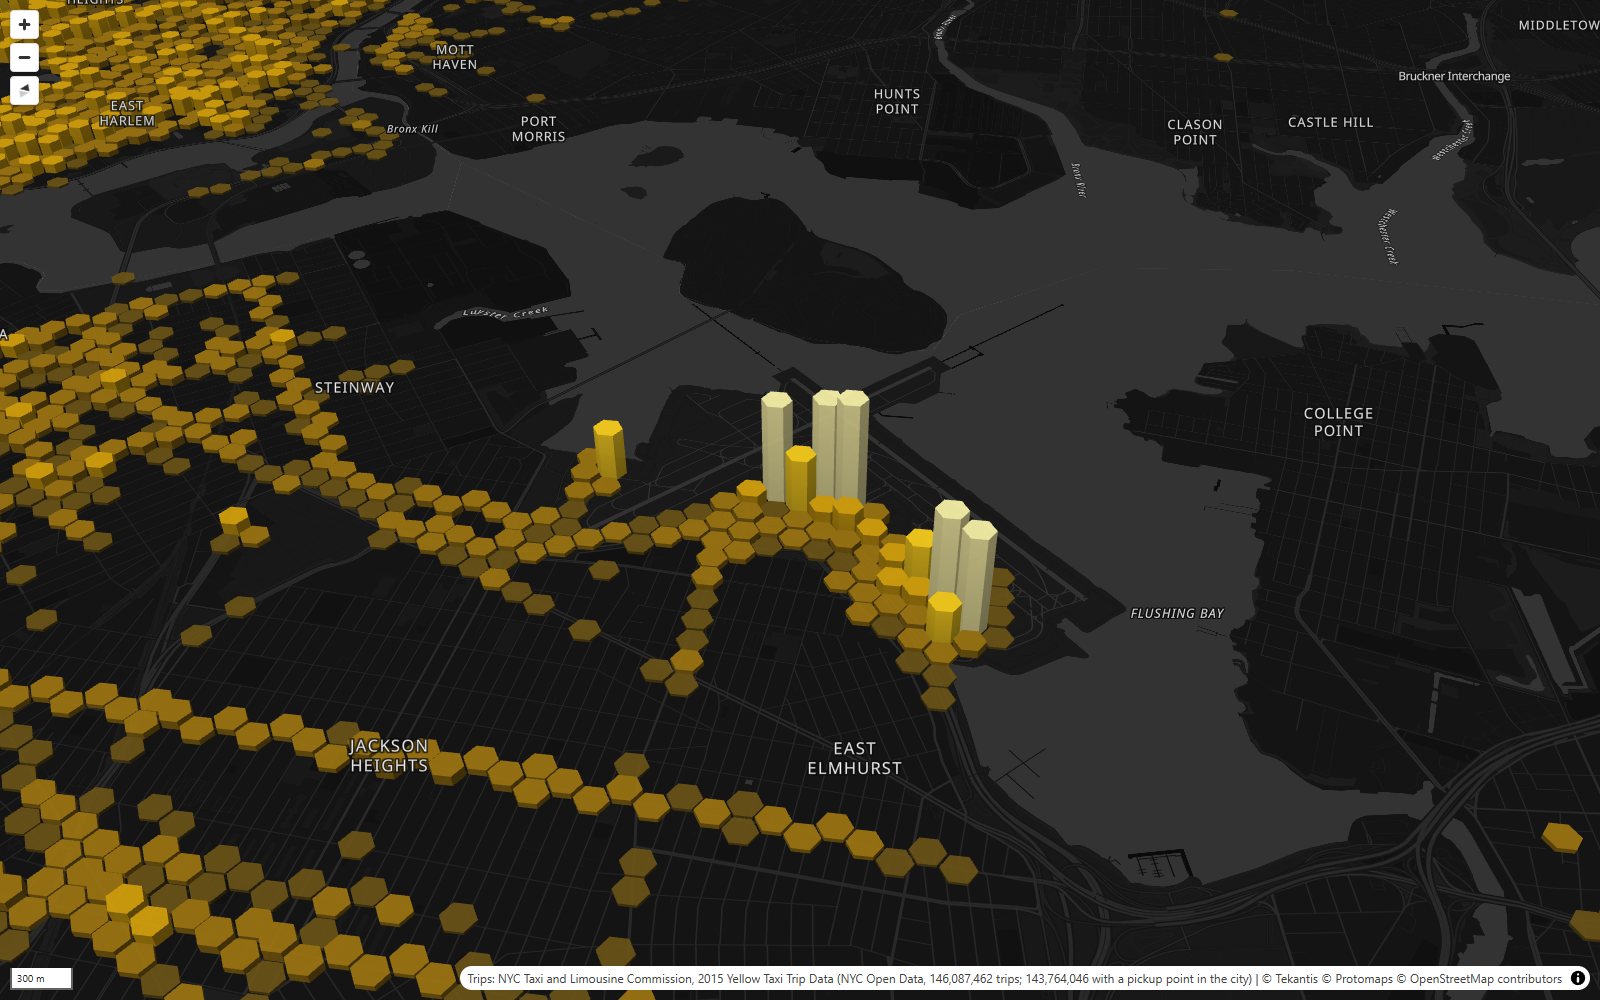
The last bookmark goes to LaGuardia. The two big airports are the only places outside Manhattan that come close to it. LaGuardia had about 3.6 million pickups in 2015, half a million more than JFK. The average fare from LaGuardia was about $32, nearly three times the Manhattan average of about $11.50. From JFK it was about $46: trips from JFK to Manhattan had a flat fare of $52. And Newark, which is in New Jersey, had about 12,000 yellow cab pickups in the whole year. Yellow cabs can take you there, but the taxi ranks at Newark are for New Jersey cabs.
How did I build it?
I built this one using Icon Map's MCP service. The trips come from NYC Open Data, which still has the 2015 trip records with the exact pickup point of every ride. The city's newer files only say which taxi zone a trip started in, so 2015 is one of the last years you can map like this. The dataset was too big to download in one go, so I fetched it one day at a time: 365 queries.
Then DuckDB, with its H3 extension, put every pickup into its smallest hexagon, and counted the larger sizes from those. That gives one small table per size, from 589 cells at the largest to just over 200,000 at the smallest, plus the hourly week and the table of destinations.
Those tables are files and tables in a Fabric lakehouse. In Icon Map for Fabric each size is a grid layer: it only needs the H3 cell id, and draws the hexagon itself. Each layer has its own zoom range, so they hand over to each other as you zoom. The two smallest sizes are too big to load at once, so they're stored as lakehouse tables and only the cells in view are loaded as you move around.
A few parts of this map are new. While building it I added grid layers on the time slider, grid layers that load only the cells in view, and an inset map that follows what you click and zooms to fit it. They're all in Icon Map for Fabric now.
How accurate is it?
The pickup points are GPS readings from the taxi meters. They can be tens of meters out, and some are plainly wrong: pickups in the rivers or on rooftops. I've dropped the cells with only a handful of pickups in the year, and the map hides cells with fewer than one pickup every two days. About 1.6% of the trips have no usable pickup point at all and aren't counted.
A hexagon can't be split exactly into seven smaller hexagons, so H3's seven children cover their parent closely but not exactly. Each pickup is counted once at every size, but the edges of a cell and its children don't quite line up.
The destinations are for the medium size cells only (about 0.74 km²): the top 12 destinations from each neighborhood with at least 2,000 pickups in the year. They're not every trip. Click a smaller hexagon and you see the trips of the neighborhood it's in.
The week is an average over the whole year, not a real week. The airport figures are for the hexagons around each airport, so they include a little of the neighborhood around them.
It's yellow cabs only. Green cabs and app-based rides aren't in this data. In 2015 Uber was already taking a growing share of New York's rides, so this is the map of its rivals' trips, drawn in its own hexagons.
Sources
Taxi trips: NYC Taxi and Limousine Commission, 2015 Yellow Taxi Trip Data, published on NYC Open Data.
Hexagon grid: H3, the hexagonal hierarchical spatial index created at Uber, open source under the Apache 2.0 license.
Basemap: © Protomaps © OpenStreetMap contributors.