

It's day 19 of the 30 Day Map Challenge, and today's theme is the second of the senses: smell. "How do you map things which your nose can sense? What does a smelly map look like?"
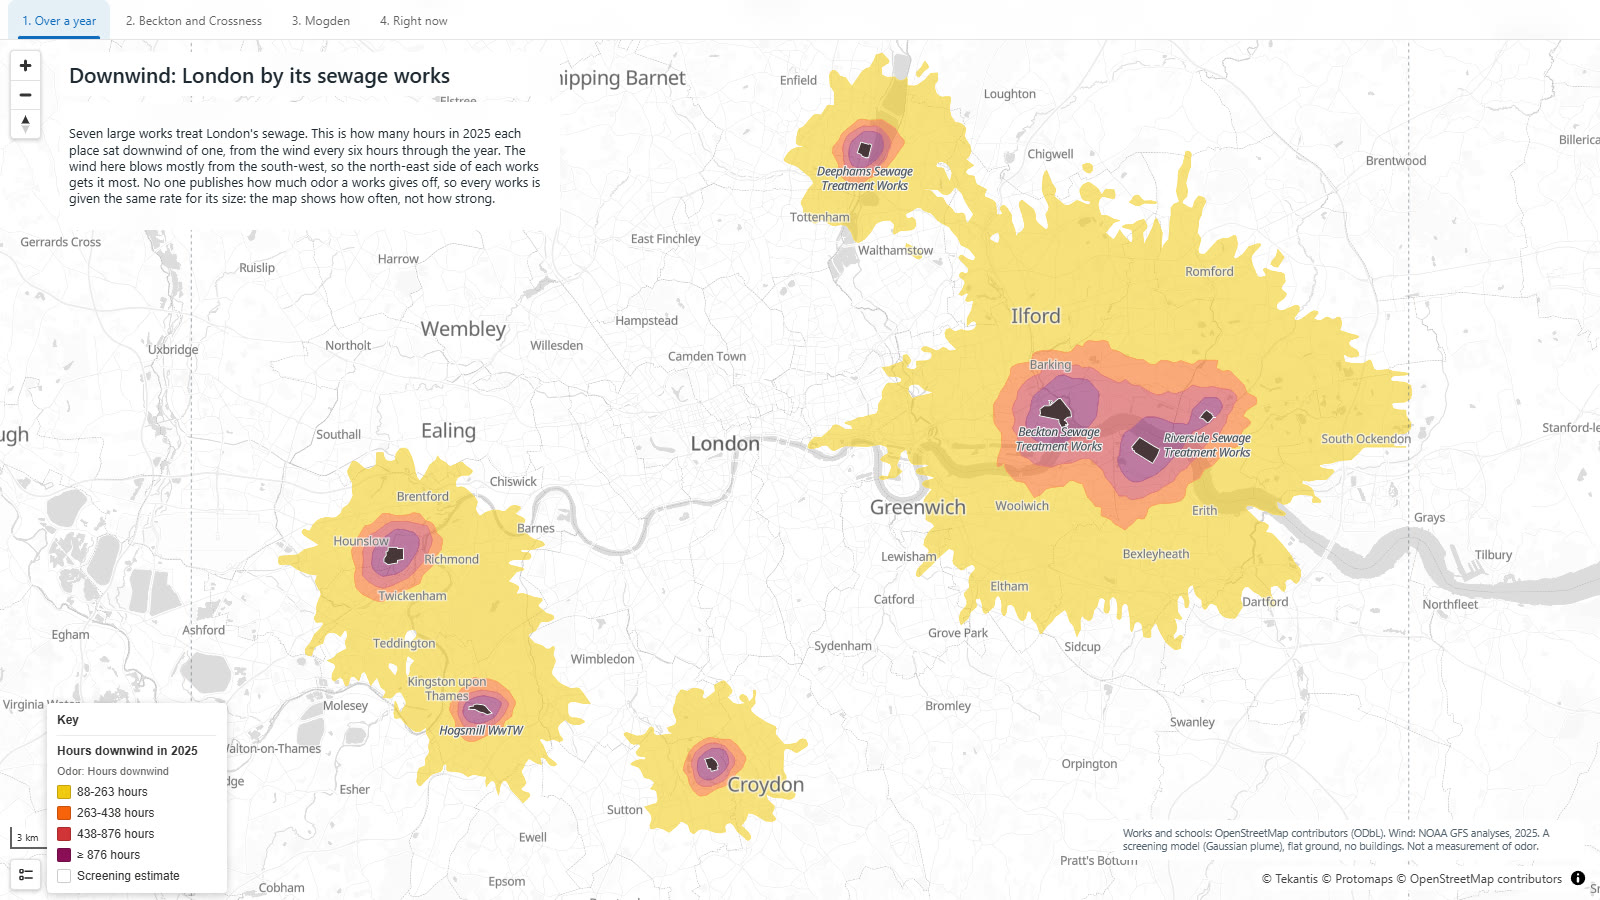
You can't see a smell, but you can see the wind, and the wind decides who gets it. So this is London by its sewage works: seven large ones, and for every place around them, how many hours in 2025 it sat downwind of one.
It isn't a map of how bad anything smells. Nobody publishes that, and I'll come back to it. It's a map of how often the air reaching you has just passed over a sewage works.
The bookmarks along the top take you round it. The first three show the year. The last one, "Right now", shows the same works under the wind at the moment you open the map, so it will be different every time you look.
Right now
This is the part I like most. The map reads the wind over London from the latest run of a global weather model, works out the plume from each works, and sends particles drifting down it. When I recorded this the wind was from the south-east, so everything was heading for Ilford and Barking. Tomorrow it will be somewhere else.
Over a year
One afternoon's wind doesn't tell you much about a place. A year does. For the long-run view the map takes the wind every six hours through the whole of 2025, 1,460 readings, works out the plume for each, and counts the hours every spot spent inside one.
In 2025 the wind over London blew from the south-west more often than from anywhere else: 23% of the time, with south and west 14% each. So the footprints lean to the north-east, but not by as much as I expected. The wind came from the north-east 13% of the time too, and close to a works you are downwind of it whenever the wind swings your way at all.
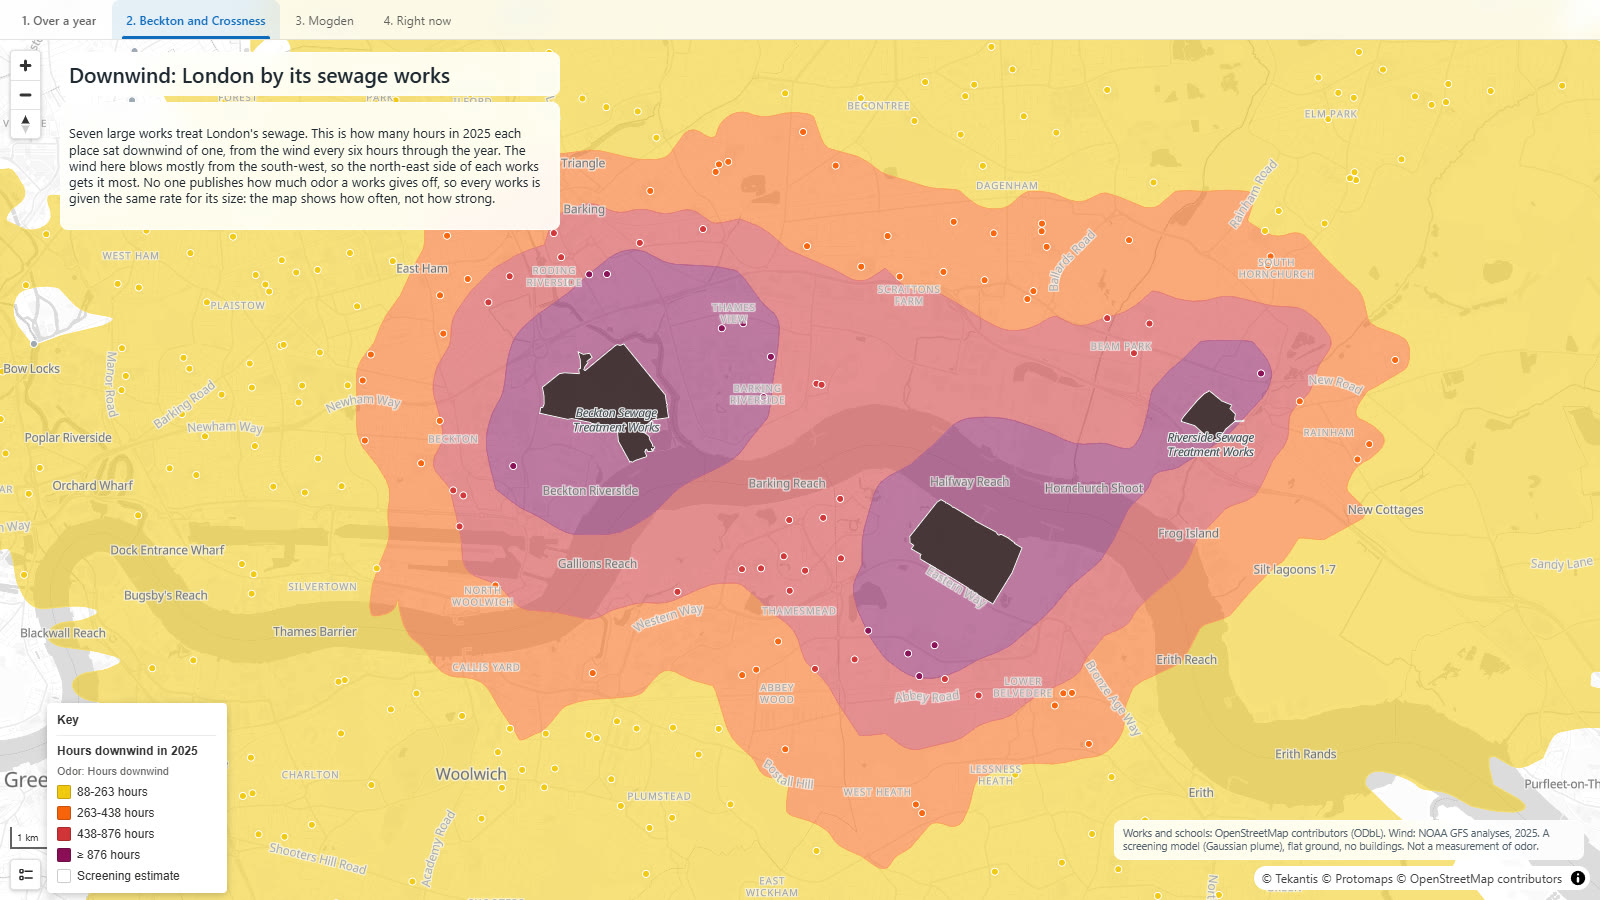
The two biggest face each other across the Thames. Beckton, on the north bank, is one of the largest sewage treatment works in Europe, and Crossness is opposite it on the south. They are where they are because of a smell. After the Great Stink of 1858, when the Thames in central London smelled so bad that Parliament could hardly sit, Joseph Bazalgette built the sewers that carried London's waste east, to outfalls at exactly these two places, then well beyond the edge of the city. The city has since grown out to meet them. The gray dots are schools, colored where they fall inside a band.
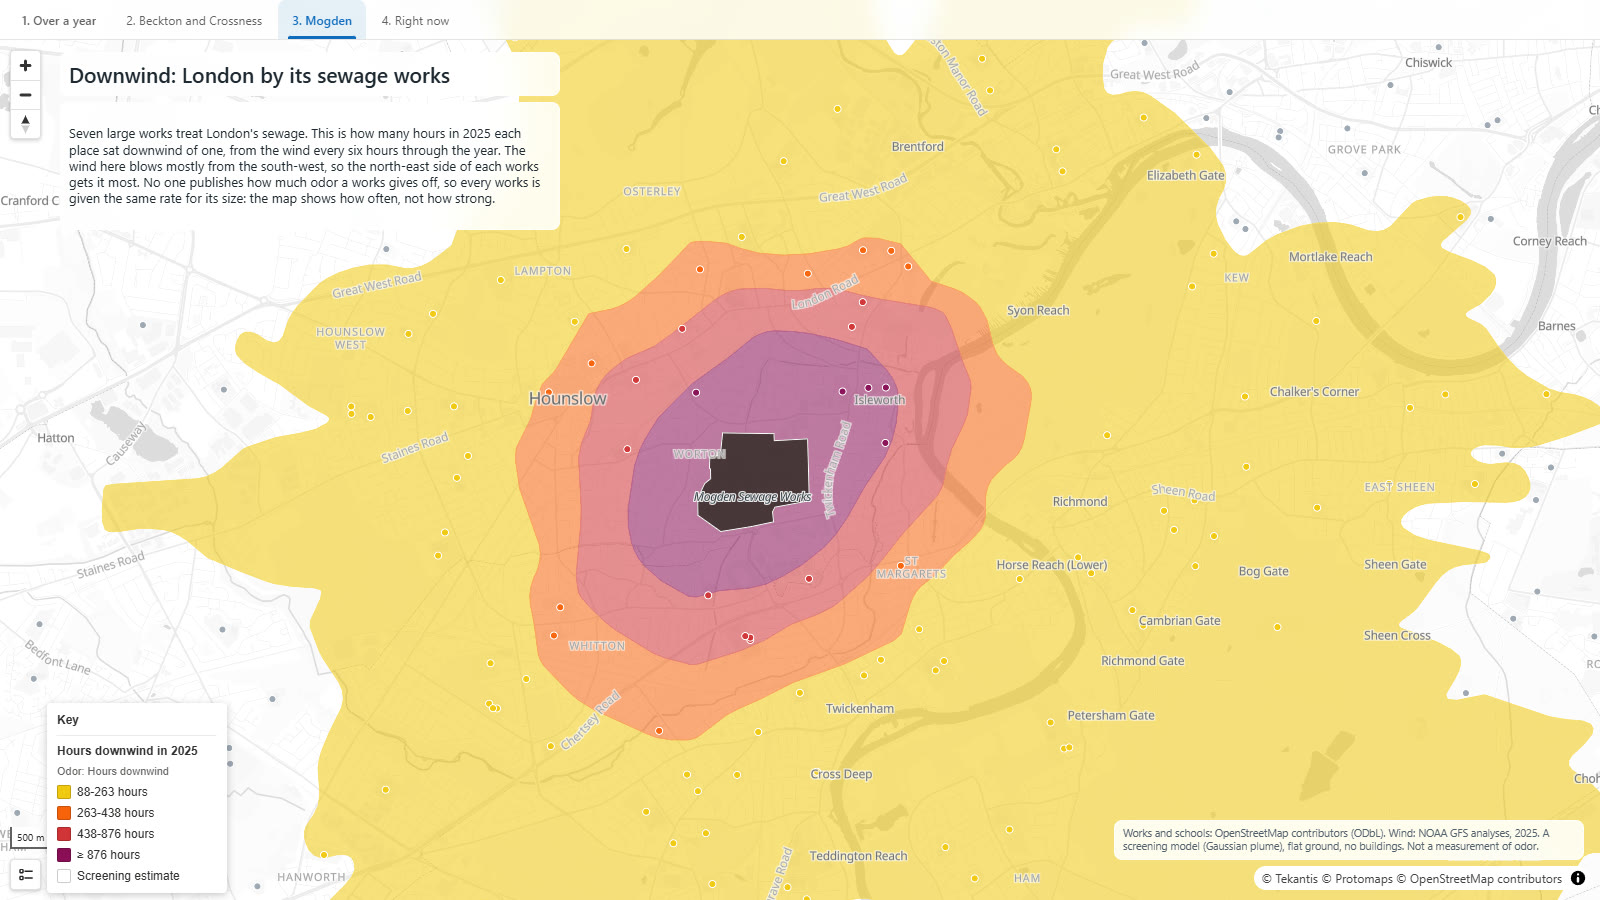
Mogden, in the west, is the other kind of site: not out on the marshes but in the middle of Isleworth, with houses on every side and Twickenham Stadium next door.
How did I build it?
This map needed something Icon Map for Fabric didn't have a week ago, so we built it. It's a new kind of layer called a plume layer, and it went live in the product the day I made this map.
A plume layer has no data of its own. You point it at other layers on the map: here, a layer of polygons for the seven works, which come from OpenStreetMap and sit in a Fabric lakehouse. It treats each one as a source releasing something into the air, reads the wind, and works out where the release goes using a Gaussian plume model, the standard first estimate for this kind of question. It can do that for the weather now, or for every reading in a period of real weather, rolled up into one picture: an average, a percentile, or as here, the hours a place spent downwind.
It can also write its answer onto other layers. The schools are an ordinary layer of points, and the plume layer colors each one by the band it falls in.
The same layer handles chimneys, roads and tanks, a fire or a leak that starts and stops, and a volcanic ash cloud.
The map itself is two plume layers over the same seven works, one for the year and one for now, and the bookmarks switch between them.
How accurate is it?
This is the important section for this map, because it would be easy to read too much into it.
It does not measure odor. There are no published figures for how much odor each works gives off, so I've given every works the same rate for each square meter of its site. That makes the bigger sites bigger sources, which is reasonable, but it knows nothing about what happens on each site: which tanks are covered, what has been upgraded, what the operator does on a bad day. A well-run works may trouble nobody.
"Downwind" needs a cut-off, and I chose it. A place counts as downwind in an hour when the model puts it above a low level of 0.5 odor units, with the rate I assumed. Choose a higher level and every footprint shrinks. Choose a lower one and they cover London. The shapes and the directions come from the wind. The sizes come from me.
The wind is from a global weather model, the NOAA GFS, at one reading every six hours for a single point over London. Real wind varies street by street and hour by hour. The spiky edges on the outer band are the model's wind directions showing through, not anything real.
The ground is flat and there are no buildings. In a real city buildings, the river and the shape of the land all push the air around.
It's a screening model. It's good for seeing a pattern and for comparing one place with another. It isn't evidence about any particular works, and it's no substitute for the detailed odor assessments that operators and regulators carry out.
The seven works are the ones in Greater London with sites larger than 18 hectares. There are smaller ones, and others just outside the boundary, that aren't shown.
Sources
Sewage treatment works and schools: © OpenStreetMap contributors, from the Geofabrik Greater London extract.
Wind: NOAA Global Forecast System, analyses for 2025 and the latest forecast for the view of the wind now.
Basemap: © Protomaps © OpenStreetMap contributors.