

It's day 16 of the 30 Day Map Challenge, and today's theme is collaborative. So Antony and I have made this one together: the same data, mapped twice. Antony has built his in Icon Map Pro in Power BI, and I've built mine in Icon Map for Fabric.
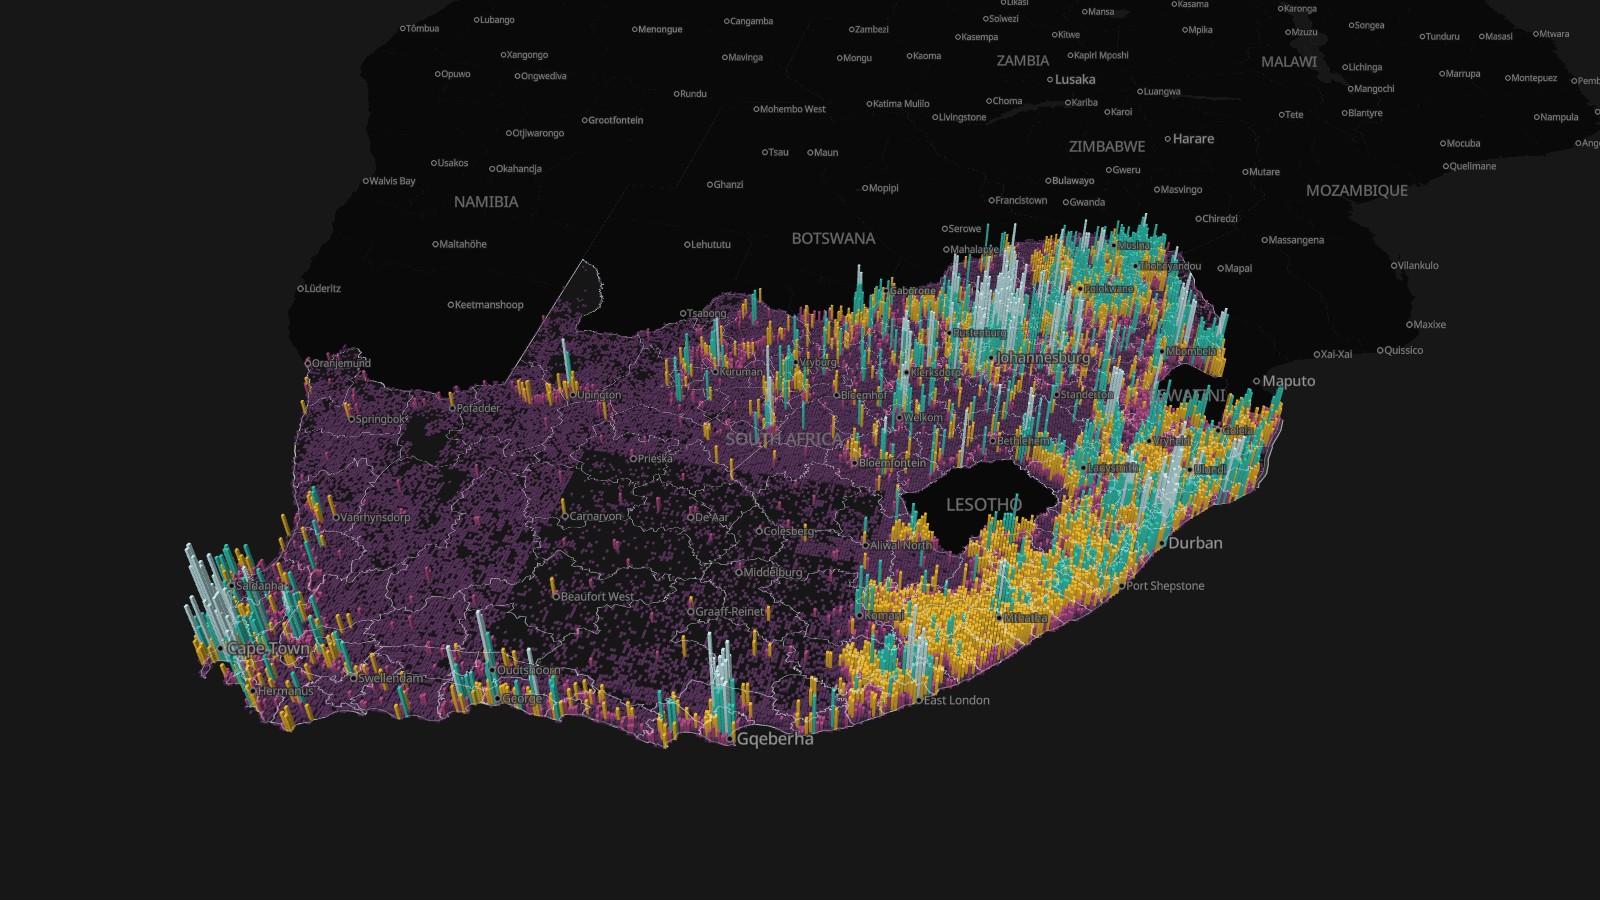
The question is a practical one. How many buildings does South Africa have, and where are they packed tightly enough for a fiber network to pay off? Telecoms planners call it "homes passed": run a cable down a street and you can sell to every building on it. Where the buildings are close together, fiber pays. Where they're far apart, you're looking at fixed wireless, or satellite.
We agreed one dataset and one set of rules, and then each took it where our own tool is strongest. Antony summarizes the buildings into geohash cells and drills down through them in a Power BI report. My job was to show the scale Fabric is built for: every one of South Africa's 33.1 million buildings, from the whole country down to a single street.
The bookmarks along the top take you through the story, but the best way to use it is to pick a place and zoom in. The cards on the right count the buildings and people in whatever you're looking at, straight from the full tables, and update as you pan. Click a municipality to filter them to it.
The rule
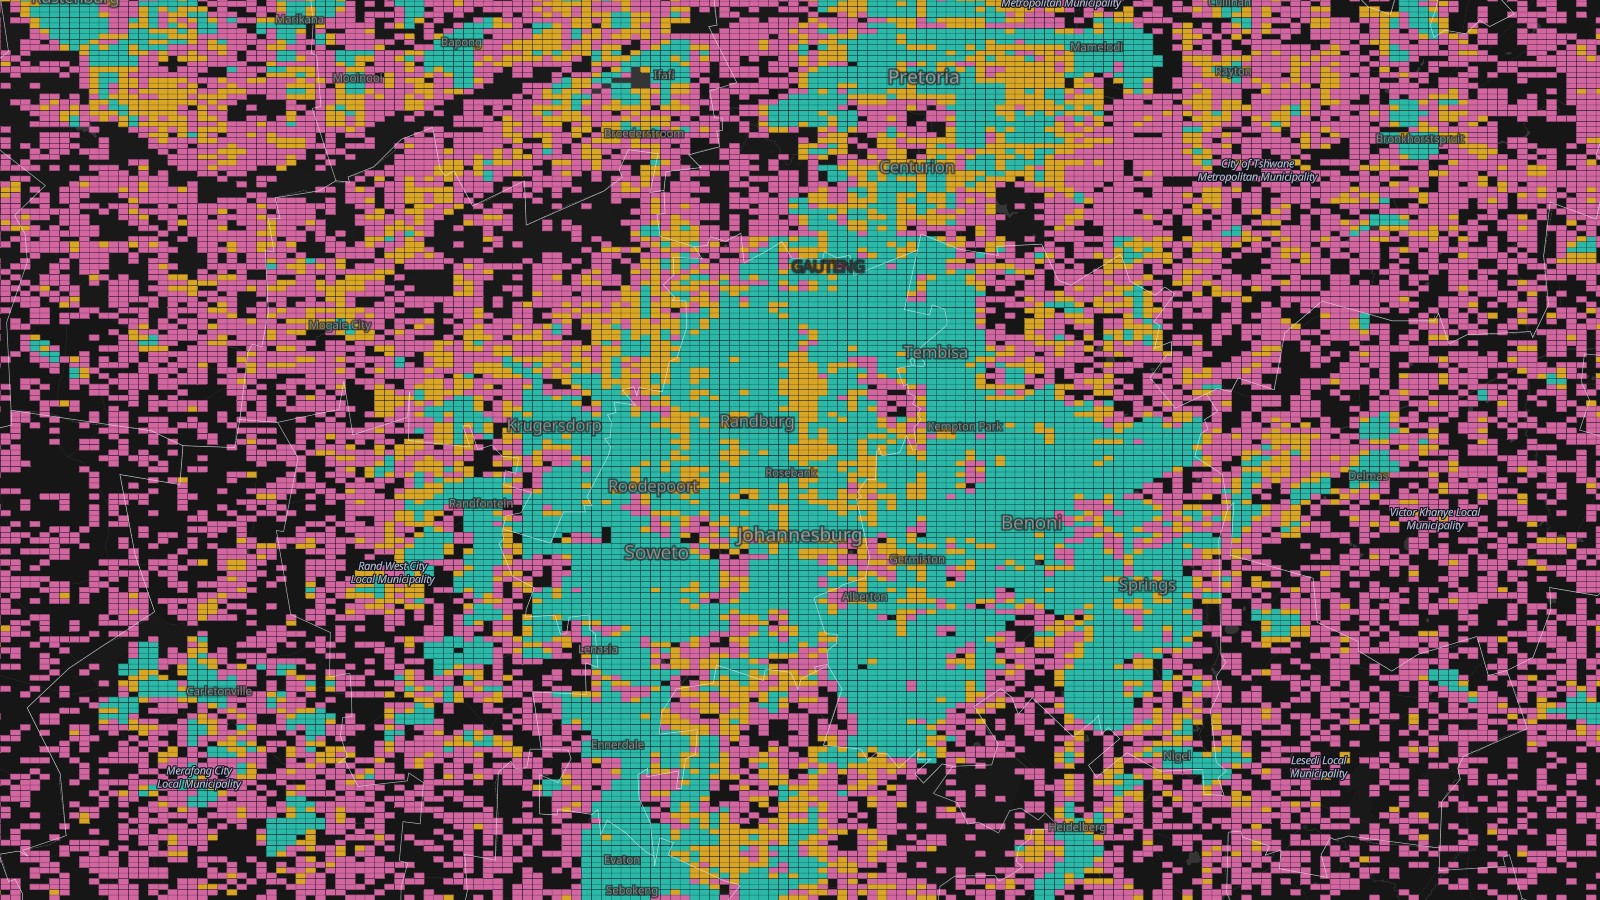
Every building is counted into a geohash cell. A geohash is a short code for a rectangle on the map, and each extra character splits it into 32 smaller ones, so the cells nest neatly inside each other. At South Africa's latitude a 5-character cell is about 4.5 km across, a 6-character cell about 1.1 by 0.6 km (roughly a neighborhood), and a 7-character cell about 150 m.
We zone each neighborhood-sized cell by its buildings per km²:
- Fiber: 200 or more buildings per km²
- Fixed wireless: 50 to 200
- Scattered: under 50
The smaller cells, and every building, take the zone of the neighborhood they're in.
What it shows
79% of South Africa's buildings, and 86% of its people, are in fiber territory. That's 26.2 million buildings and 52.8 million people. Gauteng is a single solid block of it, from Soweto to Pretoria.
Fixed wireless covers another 4.6 million buildings and 6.2 million people. Most of them are in KwaZulu-Natal, the Eastern Cape and on the edges of Gauteng, about 1.3 million in each.
That leaves 2.3 million buildings and 2.6 million people in places where the homes are simply too far apart to wire.
The threshold matters. Drop it to 100 buildings per km² and 92% of people are in fiber territory; raise it to 400 and it's 73%.
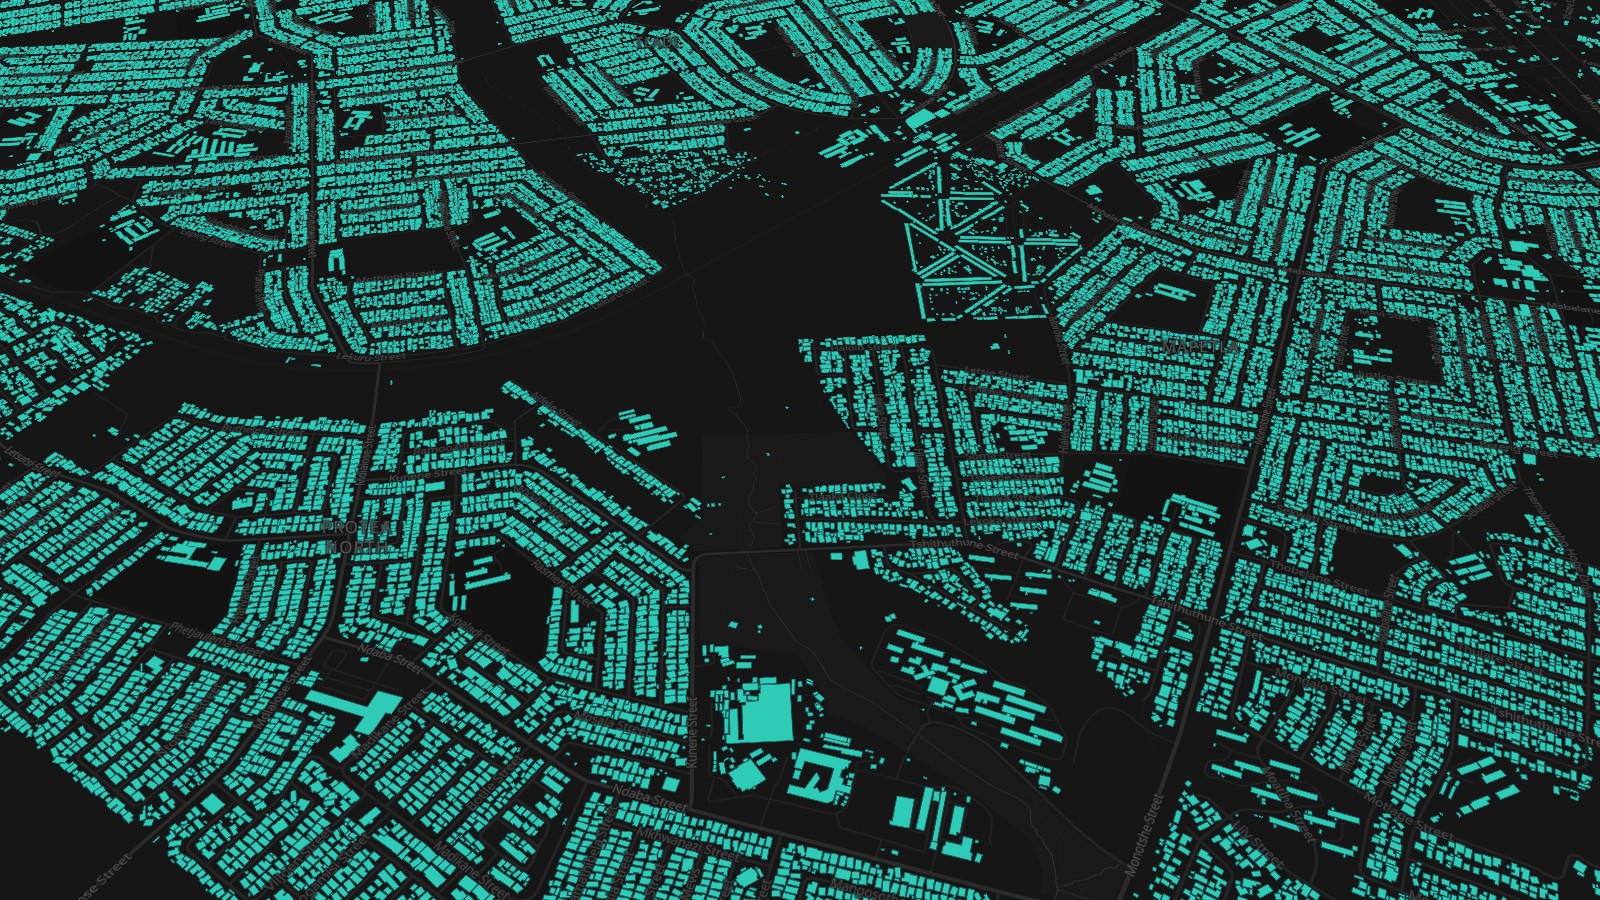
Zoom in and the 4.5 km cells hand over to 1 km cells, then 150 m cells, and from zoom 12 to every single building footprint, colored by its zone. This is the bit I wanted Fabric to show. There are no samples or summaries at this level, just all 33.1 million footprints.
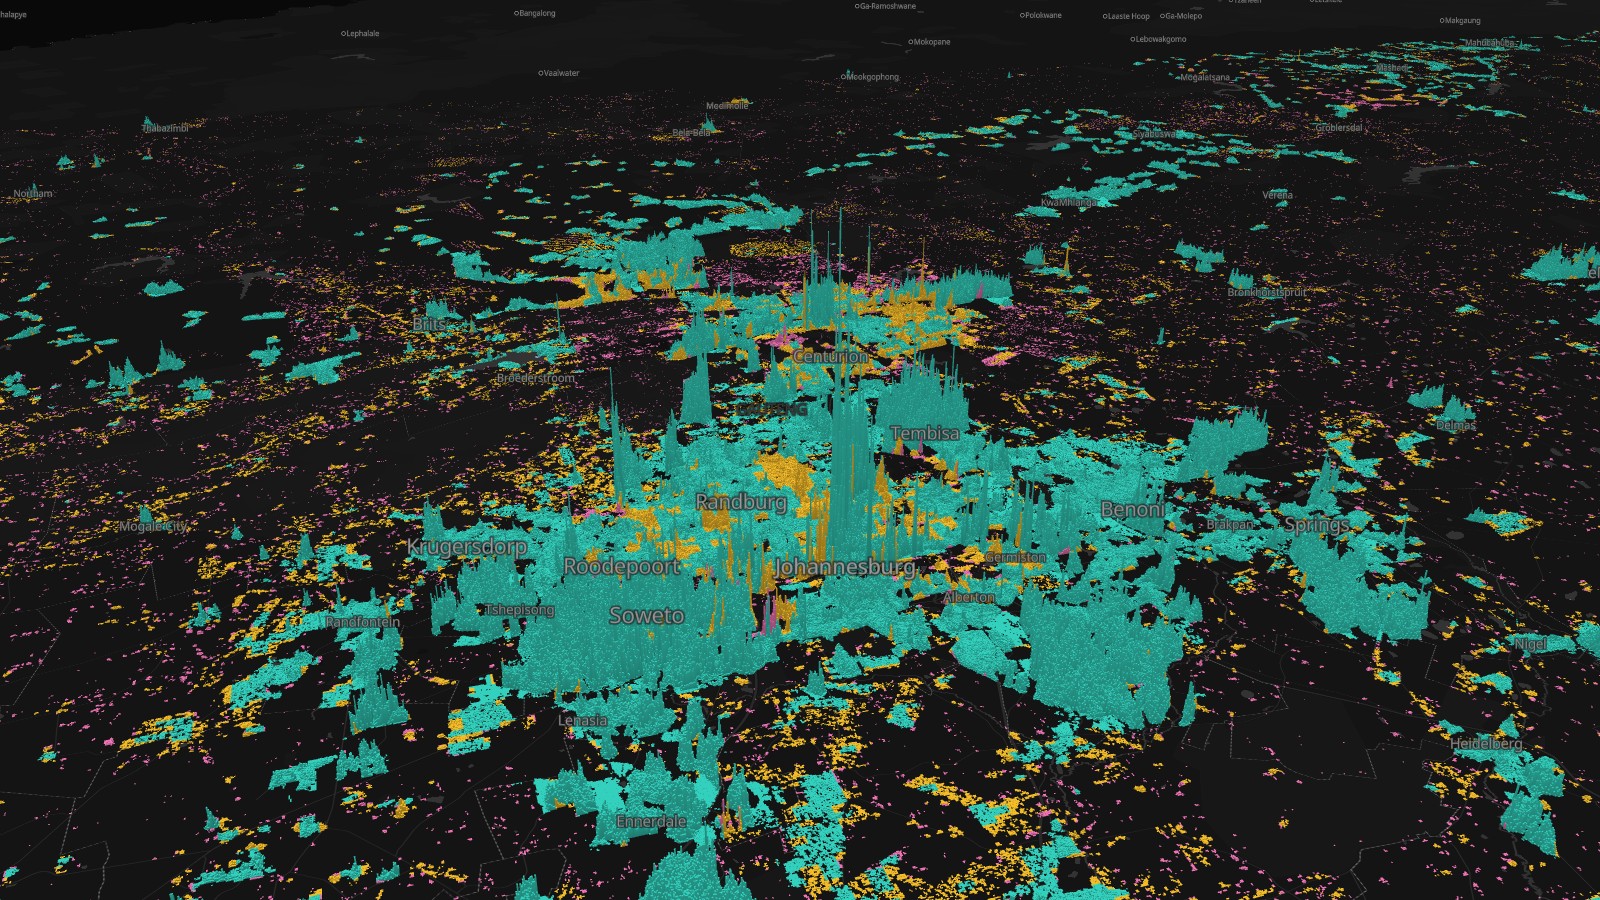
The "Where people live" bookmark swaps the buildings for people: 6.1 million 100 m squares from the GHS-POP population grid, each raised 10 m for every person who lives in it. Hillbrow and central Pretoria stand out as the peaks.
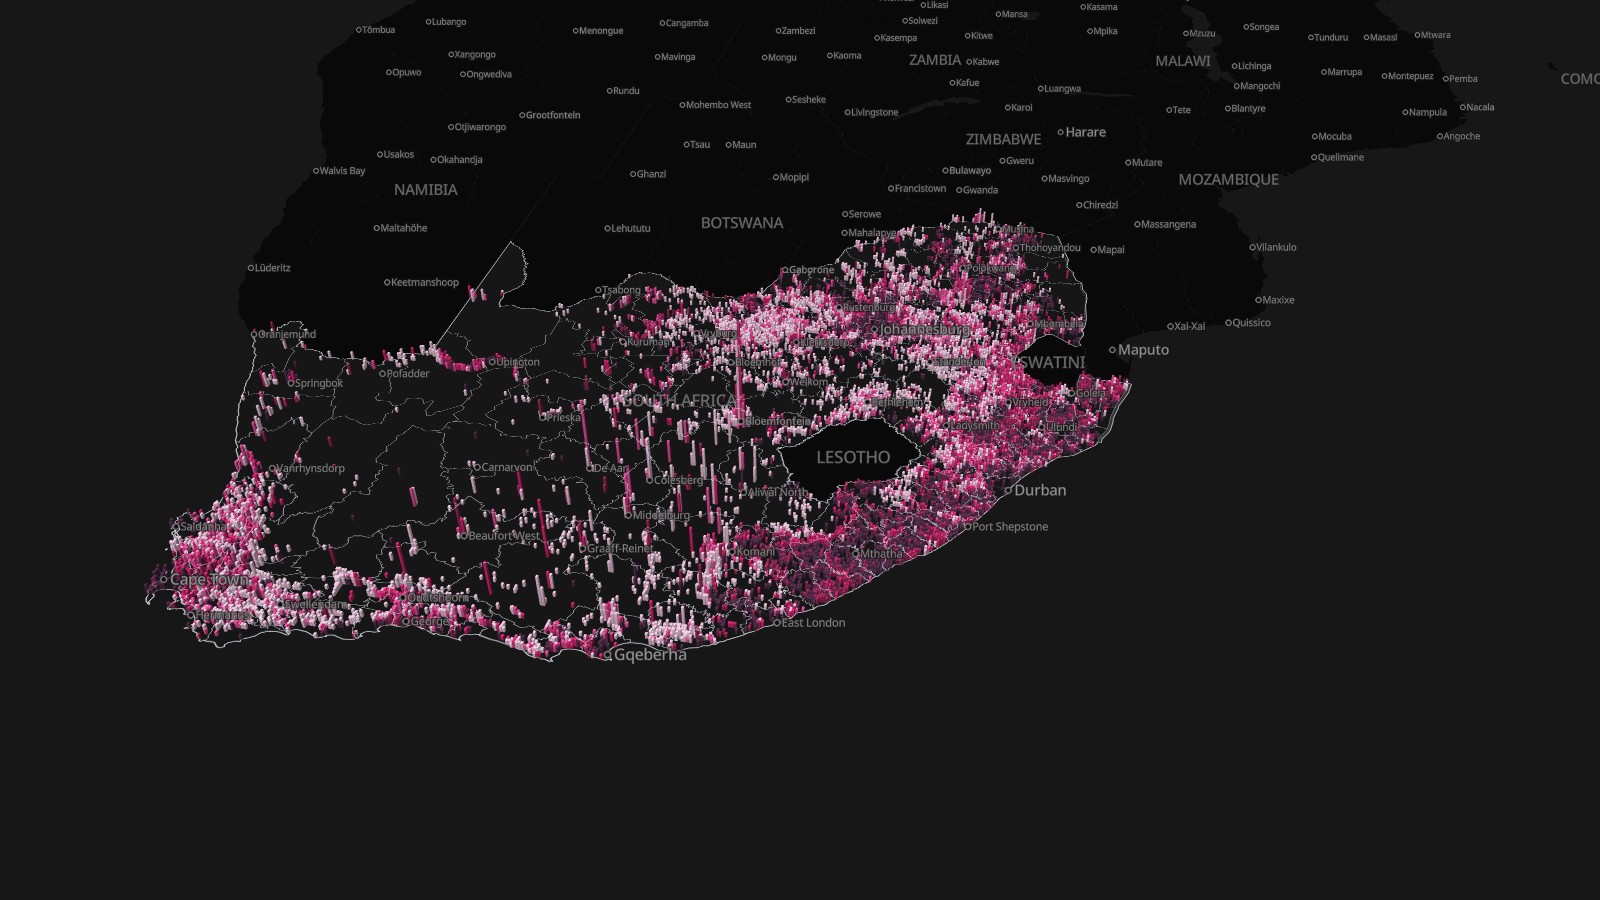
The last bookmark, "Hard to reach", shows where those 2.6 million people in scattered areas actually are. The most are in the Eastern Cape (460,000), the Western Cape (380,000) and KwaZulu-Natal (350,000). As a share of the people who live there, it's highest in the Northern Cape and the Free State, at 12 to 14%. In Gauteng it's 1%.
How did I build it?
I built this one using Icon Map's MCP service. The buildings come from the Overture Maps Foundation's October 2026 release, which merges footprints from OpenStreetMap, Microsoft and Google. I read them straight from Overture's cloud storage with DuckDB and clipped them to South Africa: 40.1 million in the bounding box, 33.1 million inside the country.
Each building's people come from the European Commission's GHS-POP 2025 grid. Each 100 m square's population is shared equally between the buildings that sit in it. About 10% of people live in squares where no building was detected, so all the people figures on the map come from the population grid itself, not from the buildings.
On the map:
- The national view is a geohash layer in cell mode, extruded by the number of buildings. Icon Map for Fabric reads geohash codes natively, so there's no geometry to build.
- The 1 km and 150 m cells, the 33.1 million footprints and the 6.1 million population squares are vector tiles, stored as PMTiles files in a Fabric lakehouse. The buildings alone are 1.6 GB of tiles.
- The cards and charts query two lakehouse tables, one row per building (33.1 million rows) and one per 100 m square (11.8 million), filtered to whatever is on screen.
- The municipal outlines are the ones I used for Day 11.
How accurate is it?
The footprints are machine-detected, so some buildings are missing and a few aren't buildings at all. Treat the counts as good estimates, not a register. A building isn't a household, either: a block of flats is one footprint, and so is a garden shed.
Detection isn't even across the country. In the Karoo there's a large rectangle where Google's footprints are noticeably sparser than in the land around it, and you can see its straight edges in the national view. Because there are fewer buildings in the data there, towns such as Colesberg and Beaufort West fall below the thresholds and show up as "hard to reach" when they're not. On the map, three quarters of the people in Umsobomvu, the municipality around Colesberg, live in scattered areas, which I don't believe. It also pushes up the Northern Cape's share.
Geohash cells are rectangles of latitude and longitude, so they get narrower towards the poles. Across South Africa that's only a few percent, and the densities use each cell's real area.
The heights in the national view grow with the square root of the number of buildings. With a straight scale, only the biggest cities would show at all.
Overture includes heights for only about 10,000 of the 33.1 million buildings, so the footprints are flat.
Sources
Buildings: Overture Maps Foundation, buildings theme, release 2026-10-21.0 (ODbL), from OpenStreetMap contributors, Microsoft and Google.
Population: GHS-POP R2023A, 2025 epoch, 100 m, European Commission Joint Research Centre (CC BY 4.0).
Country outline: geoBoundaries (CC BY 3.0 IGO), from OCHA ROSEA and South Africa's Municipal Demarcation Board.
Municipalities: © OpenStreetMap contributors (ODbL).
Basemap: © Protomaps © OpenStreetMap contributors.