

It's day 12 of the 30 Day Map Challenge, and today's theme is power.
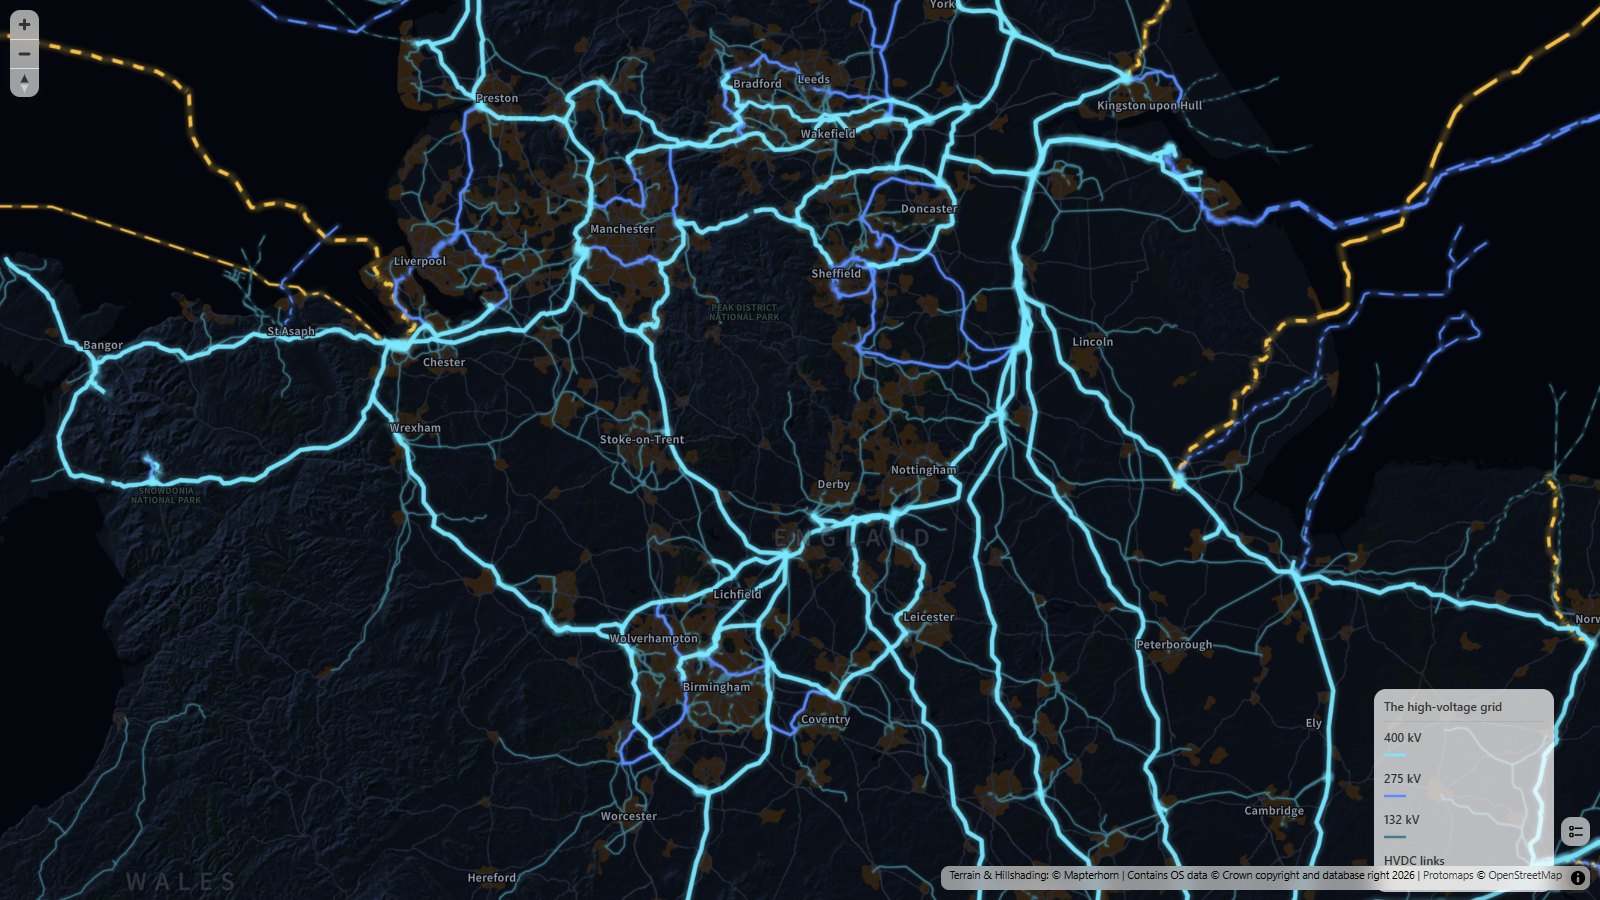
I've mapped the pylons that carry Britain: the high-voltage electricity grid of Great Britain, from the 400 kV supergrid down to the 132 kV lines, plus the HVDC links that run under the sea to our neighbors. The 400 kV lines are cyan, 275 kV blue and 132 kV teal. The gold dashed lines are the HVDC links.
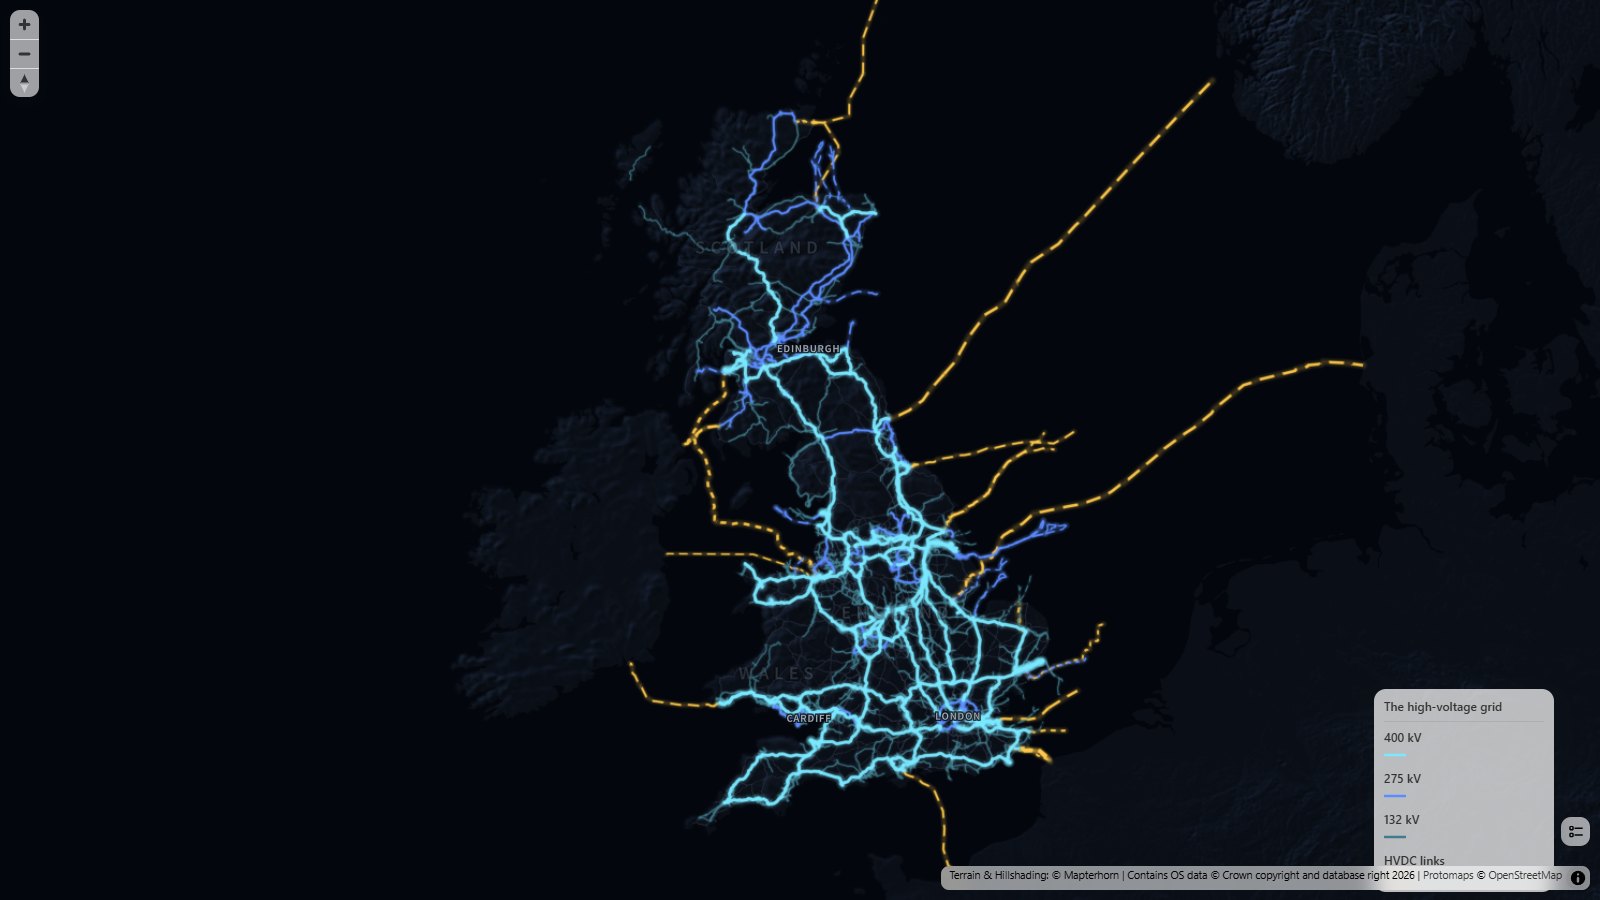
Zoomed out, it's a glowing map of the grid. That's about 26,000 km of lines and cables at 132 kV and above, as mapped in OpenStreetMap. You can pick out the supergrid running the length of the country, the rings around the big cities and the lines heading out to the power stations along the coasts. Out at sea, the HVDC links run to Norway (North Sea Link), Denmark (Viking Link), the Netherlands (BritNed), Belgium (Nemo Link), France (IFA, IFA2 and ElecLink), Ireland (East-West Interconnector and Greenlink) and Northern Ireland (Moyle), and up the west coast of Scotland on the Western HVDC Link.
Zoom in past the city level and the map switches to 3D. Every pylon is placed where OpenStreetMap says it stands, more than 70,000 of them, and the conductors are strung from tower to tower with a sag between them. The towers sit on the terrain, so the lines climb and drop with the landscape.
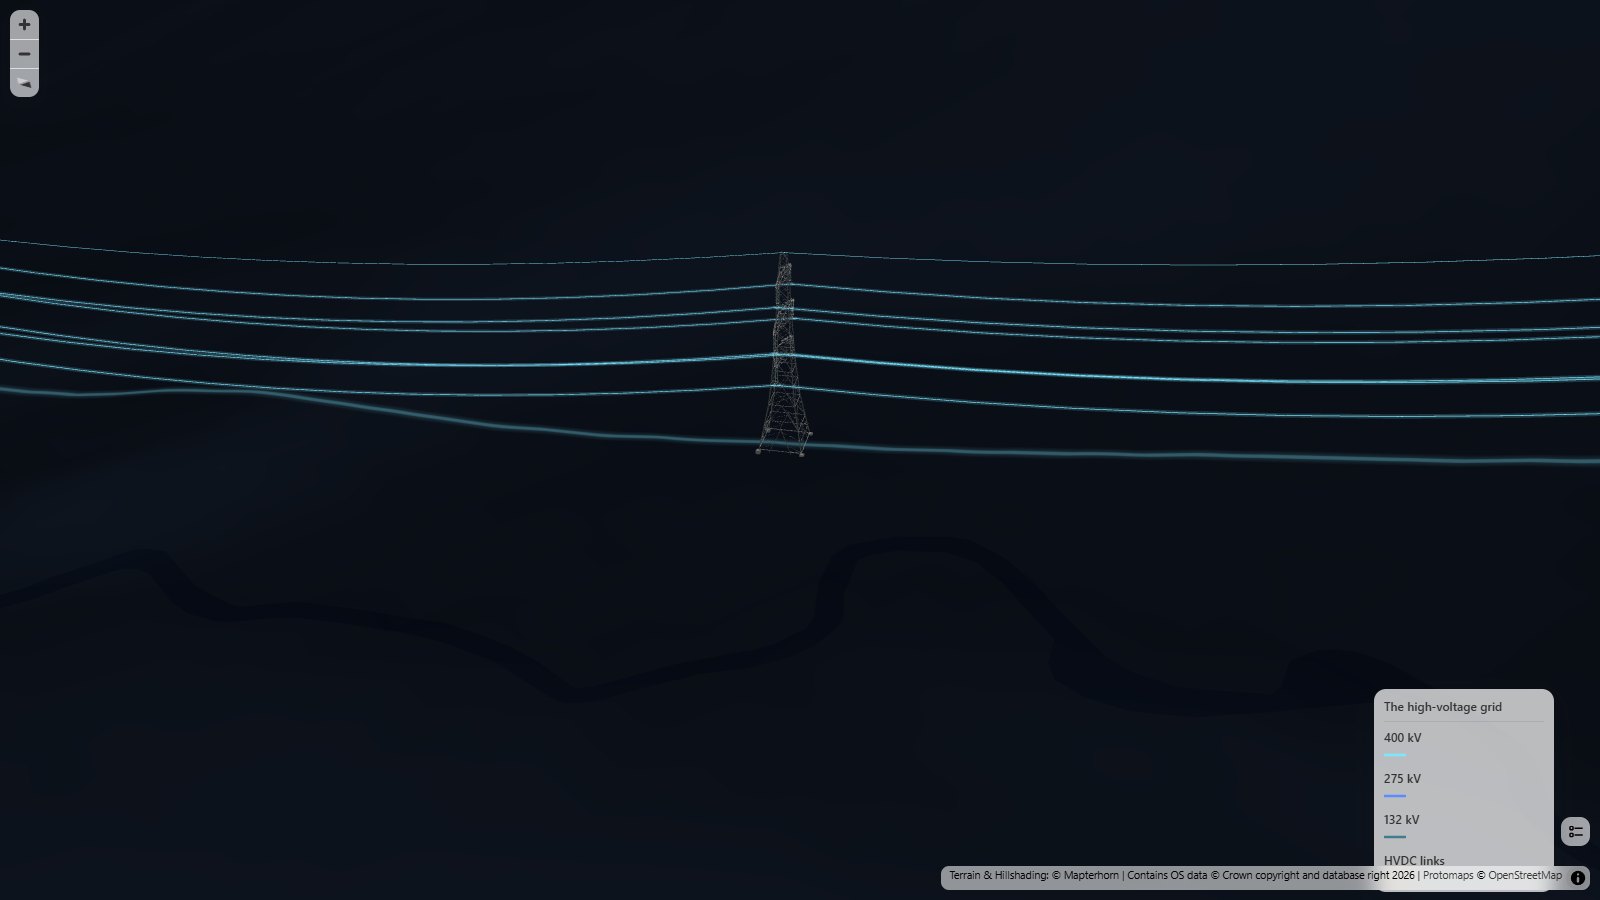
For this map I built 3D models of the main British pylon designs and added them to the Icon Map catalog, so they're there for anyone to use. The 400 kV lines use the familiar 50 m double circuit lattice tower, the 275 kV lines the 1950s supergrid tower, and the 132 kV lines the smaller double circuit tower, with a single circuit version where a line only carries one circuit. Where OpenStreetMap says a 132 kV line is on wooden H-poles, it gets a wooden trident pole. Each design has a heavier angle (tension) tower too, used where the line turns a corner or ends, with the conductors clamped front and back rather than hanging from insulators.
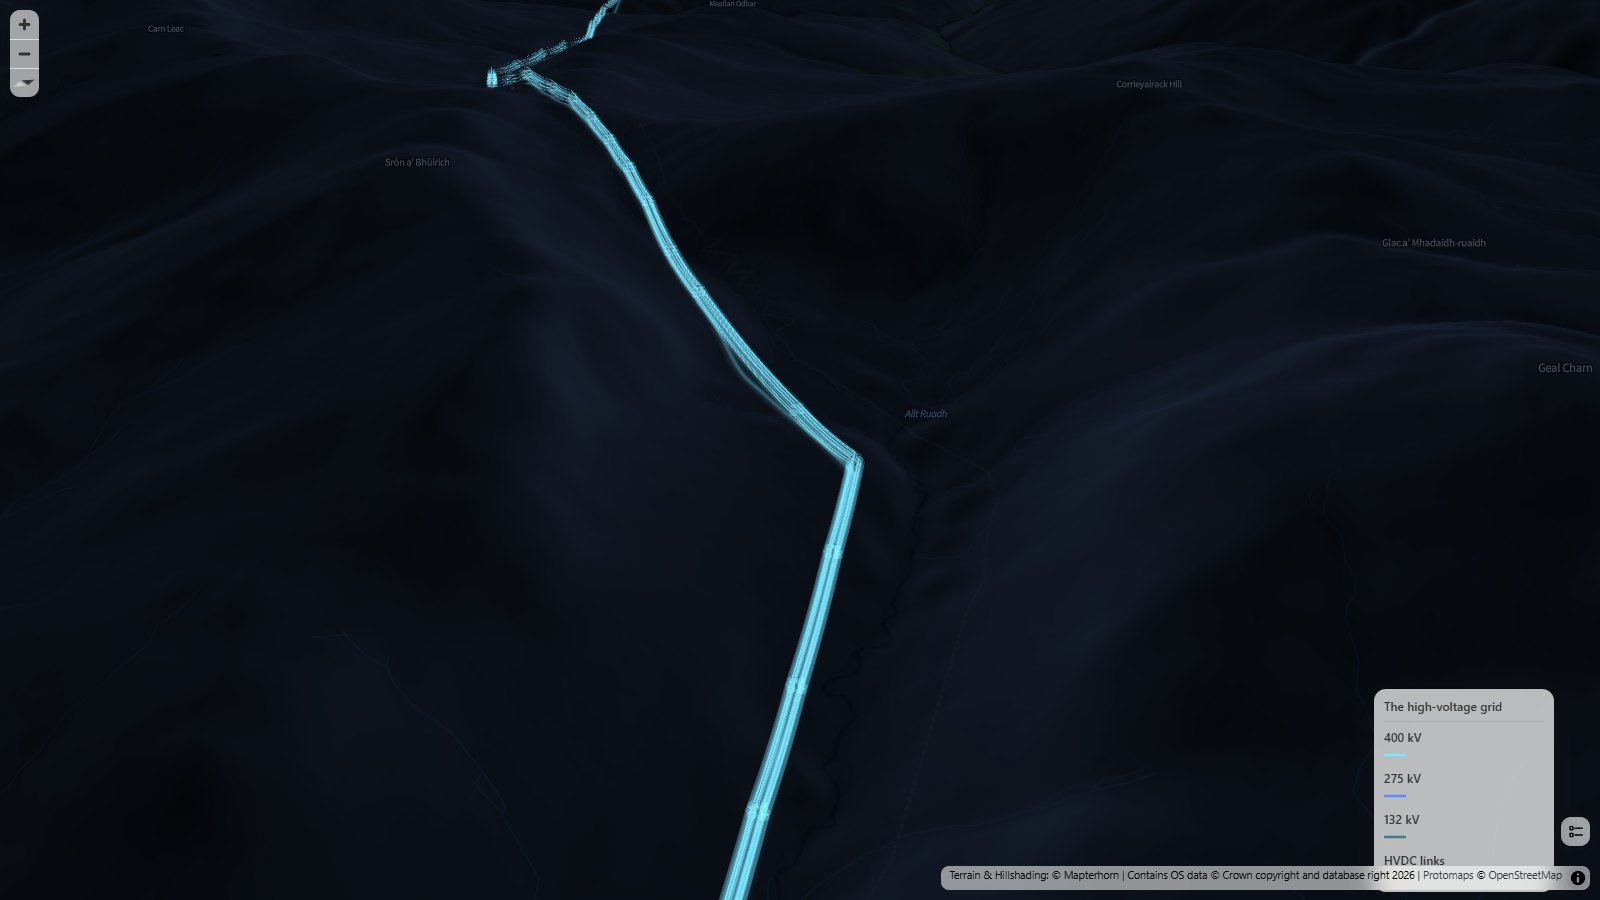
My favorite stretch is the Beauly to Denny line, which crosses the Monadhliath mountains and the Corrieyairack Pass on its way from the Highlands to the central belt:
And the tallest pylons in the country are the two 190 m towers that carry 400 kV across the Thames between West Thurrock and Swanscombe. They have their own model:
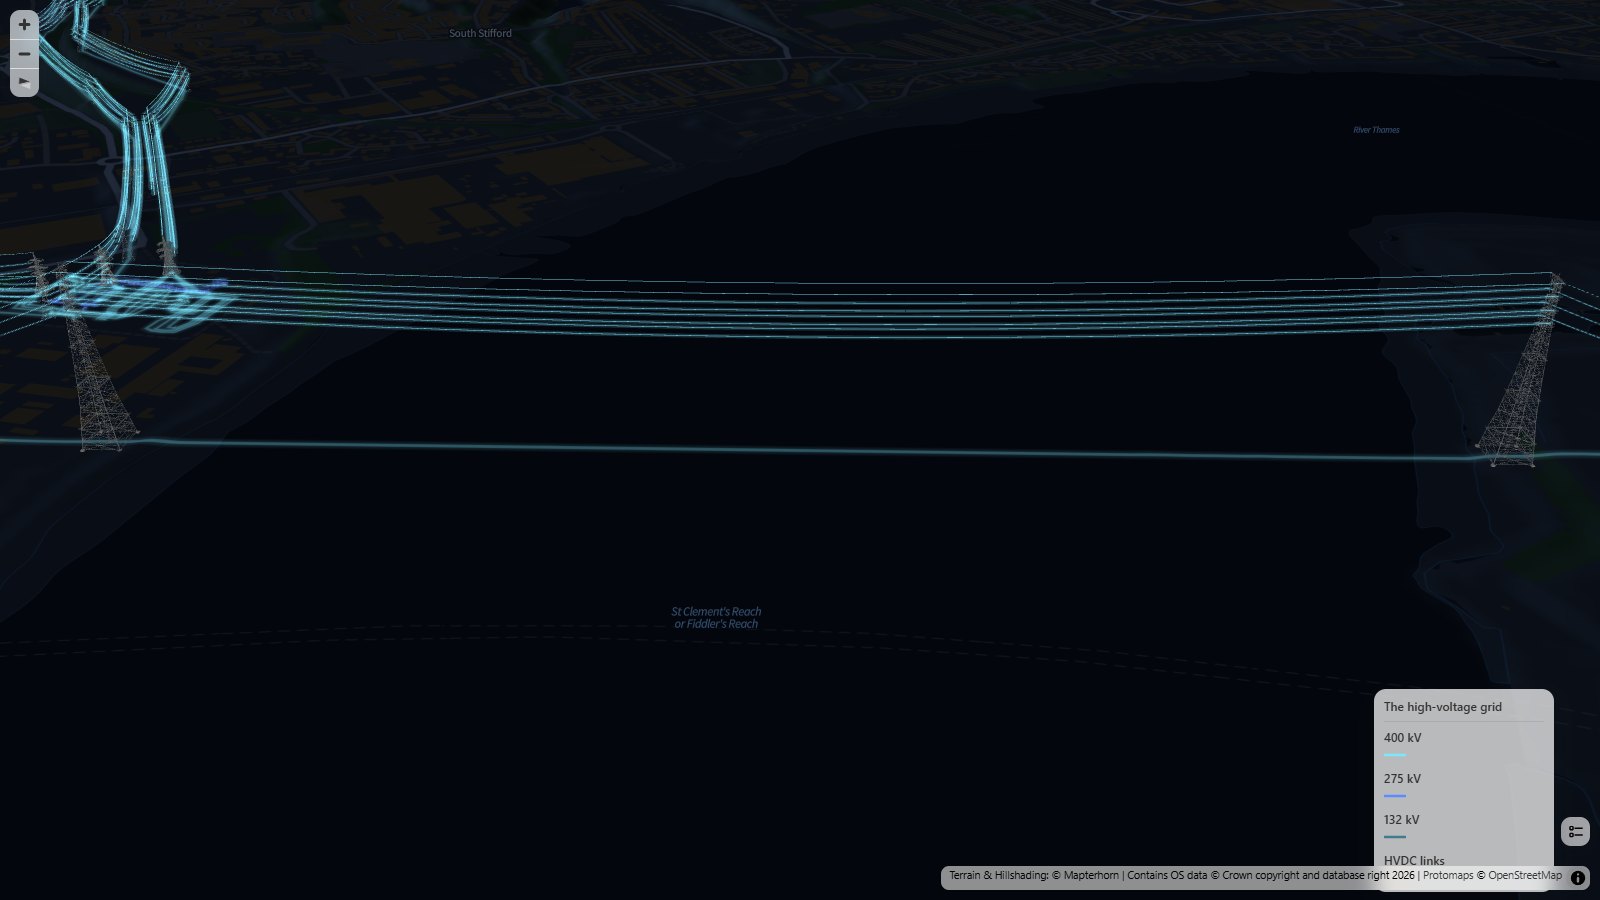
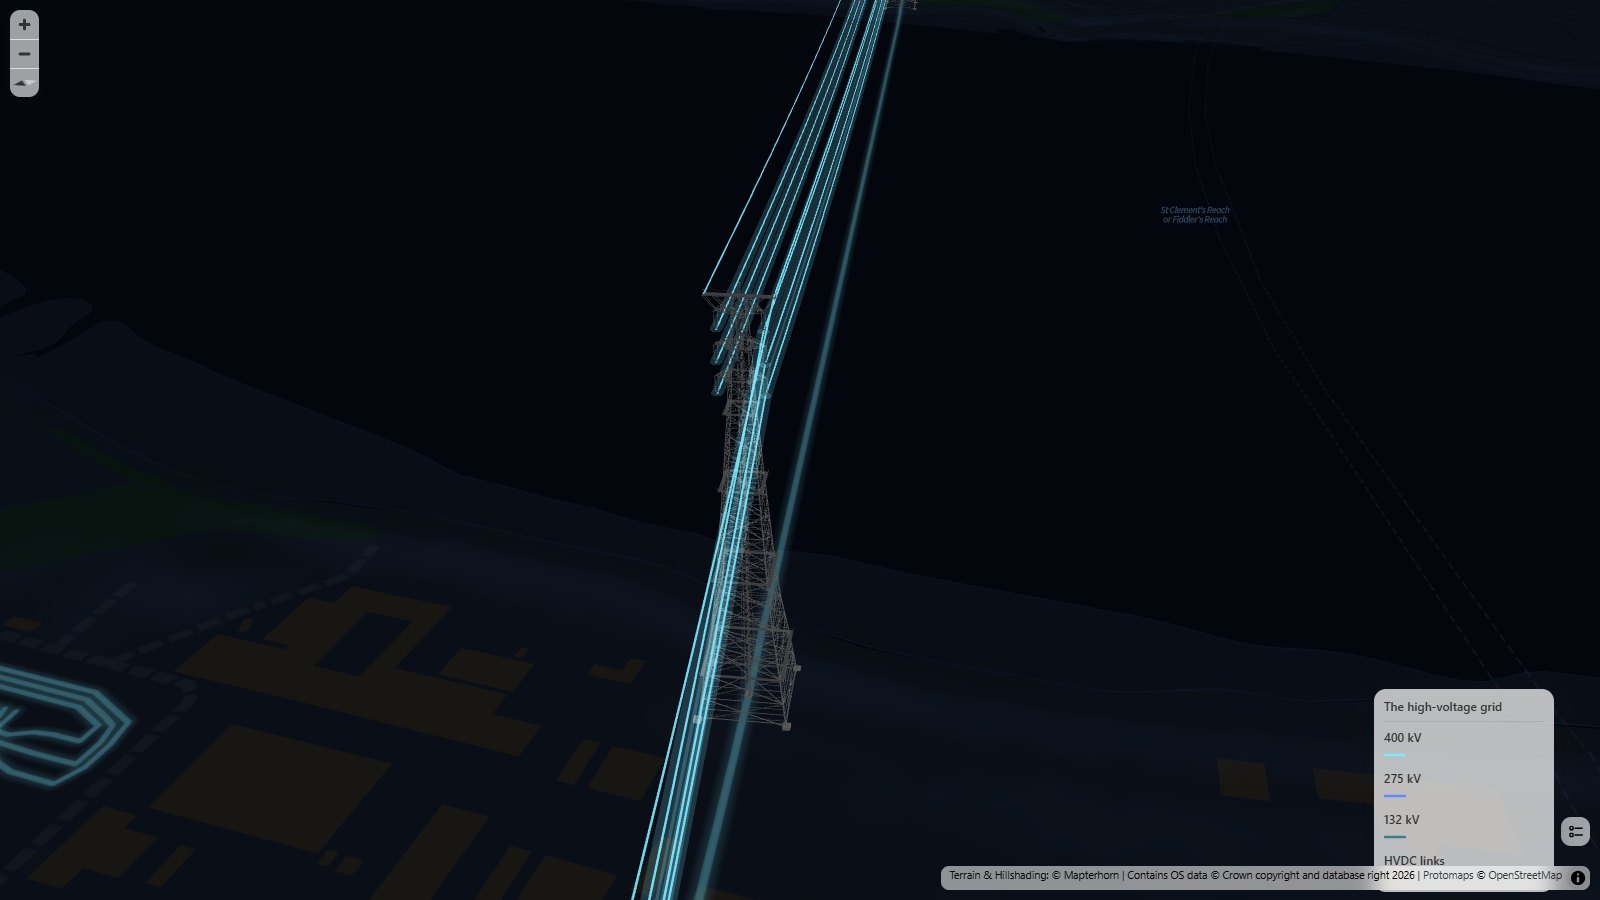
The underground cables are there too. In 3D they're drawn below the ground as glowing tubes, so you can see them through the surface. That's where much of London's grid runs.
Zoom in on a line near you and tilt the map (right-click and drag) to see the pylons. Hover over a line to see its name, voltage and operator.
How did I build it?
I built this one using Icon Map's MCP service. The lines, cables and towers all come from OpenStreetMap. I took every power line and cable in Great Britain at 132 kV and above, and every tower and pole along them, and split them by voltage. Each line keeps its route, whether it's overhead, underground or under the sea, and how many circuits it carries.
OpenStreetMap doesn't always say what kind of tower is which, so where it doesn't, the map works it out from the line. A tower where the line turns by more than a few degrees, or where it ends, is an angle tower. Everything else is a suspension tower. The two Thames crossing towers get the crossing model.
Each voltage is an infrastructure layer in Icon Map for Fabric, drawn twice. Zoomed out, it's a flat glowing line, with the glow drawn from a merged copy of the network so it doesn't build up into bright spots where the mapped pieces of a line meet. Zoomed in, it's the 3D layer with the towers, conductors and buried cables. Seventy thousand detailed pylons is a lot to draw, so each one swaps to a much lighter stand-in when it's small on screen, and only the ones close to the camera are drawn in full.
The basemap is a custom dark style I made for this map, built on Ordnance Survey's OS Open Zoomstack with Protomaps outside Great Britain, and the terrain and hillshading come from Mapterhorn.
How accurate is it?
It's only as good as OpenStreetMap, which is very good for the grid in Great Britain, but not perfect. Some towers are missing, a few lines have no voltage, and some double circuit lines are mapped as two separate lines, which also means the 26,000 km is a total of the mapped lines rather than of distinct routes.
The towers are standard designs at standard heights, not each tower's real height, and the conductors are strung in a simple curve, so the sag isn't measured. Lines that OpenStreetMap tags as carrying a single circuit hang their conductors on one side of the tower, except on 132 kV suspension towers, where the single circuit tower is used. There's no single circuit angle tower yet, so those are drawn as double circuit towers.
The buried cables are drawn at an illustrative depth below the ground, not their real depth. The map stops at 132 kV, which is part of the transmission network in Scotland but the distribution network in England and Wales, so the 33 kV and 11 kV lines that run along most streets aren't shown.
Sources
Power lines, cables, towers and poles: © OpenStreetMap contributors, available under the Open Database License. Extract from Geofabrik, downloaded 9 November 2026.
Basemap: OS Open Zoomstack, contains OS data © Crown copyright and database right 2026, available under the Open Government Licence. Outside Great Britain: Protomaps © OpenStreetMap contributors.
Terrain and hillshading: © Mapterhorn.
Pylon and pole models: Tekantis, from the Icon Map catalog.