

It's day 11 of the 30 Day Map Challenge, and today's theme is sound.
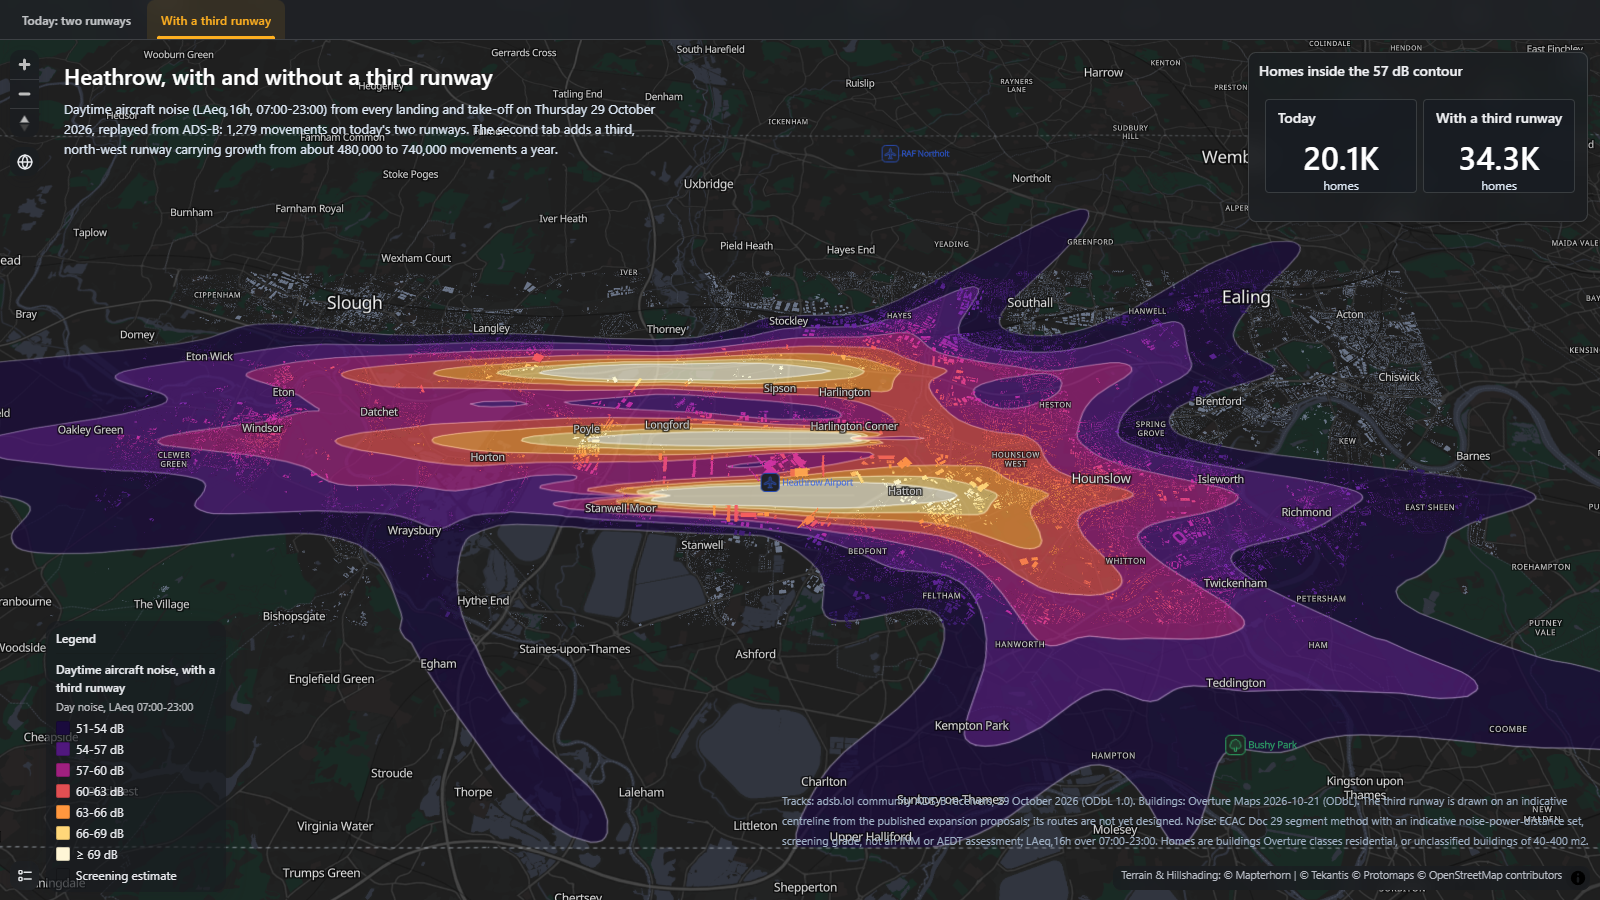
Aircraft noise felt like the natural place to start, and Heathrow has a question that people living around it have been asking for years: what would a third runway actually sound like on the ground? So this map takes one real day of flights at Heathrow, works out the noise every landing and take-off leaves behind, and then runs the same day again with a third runway added to the north-west.
The first tab is Thursday 29 October 2026 as it was actually flown: 1,279 movements on Heathrow's two runways, replayed from ADS-B position reports. The second tab adds 691 flights, roughly the growth from about 480,000 to 740,000 movements a year that a third runway is meant to allow, and puts them on an indicative north-west runway between Harmondsworth and Sipson.
The contours show daytime noise as LAeq,16h, the average sound level between 07:00 and 23:00, which is the measure UK airports use for their daytime noise contours. I've counted homes against the 57 dB contour, the level the UK has long used to mark the onset of significant community annoyance. The outer 51 dB band is the lowest level at which the government considers adverse effects start to be seen.
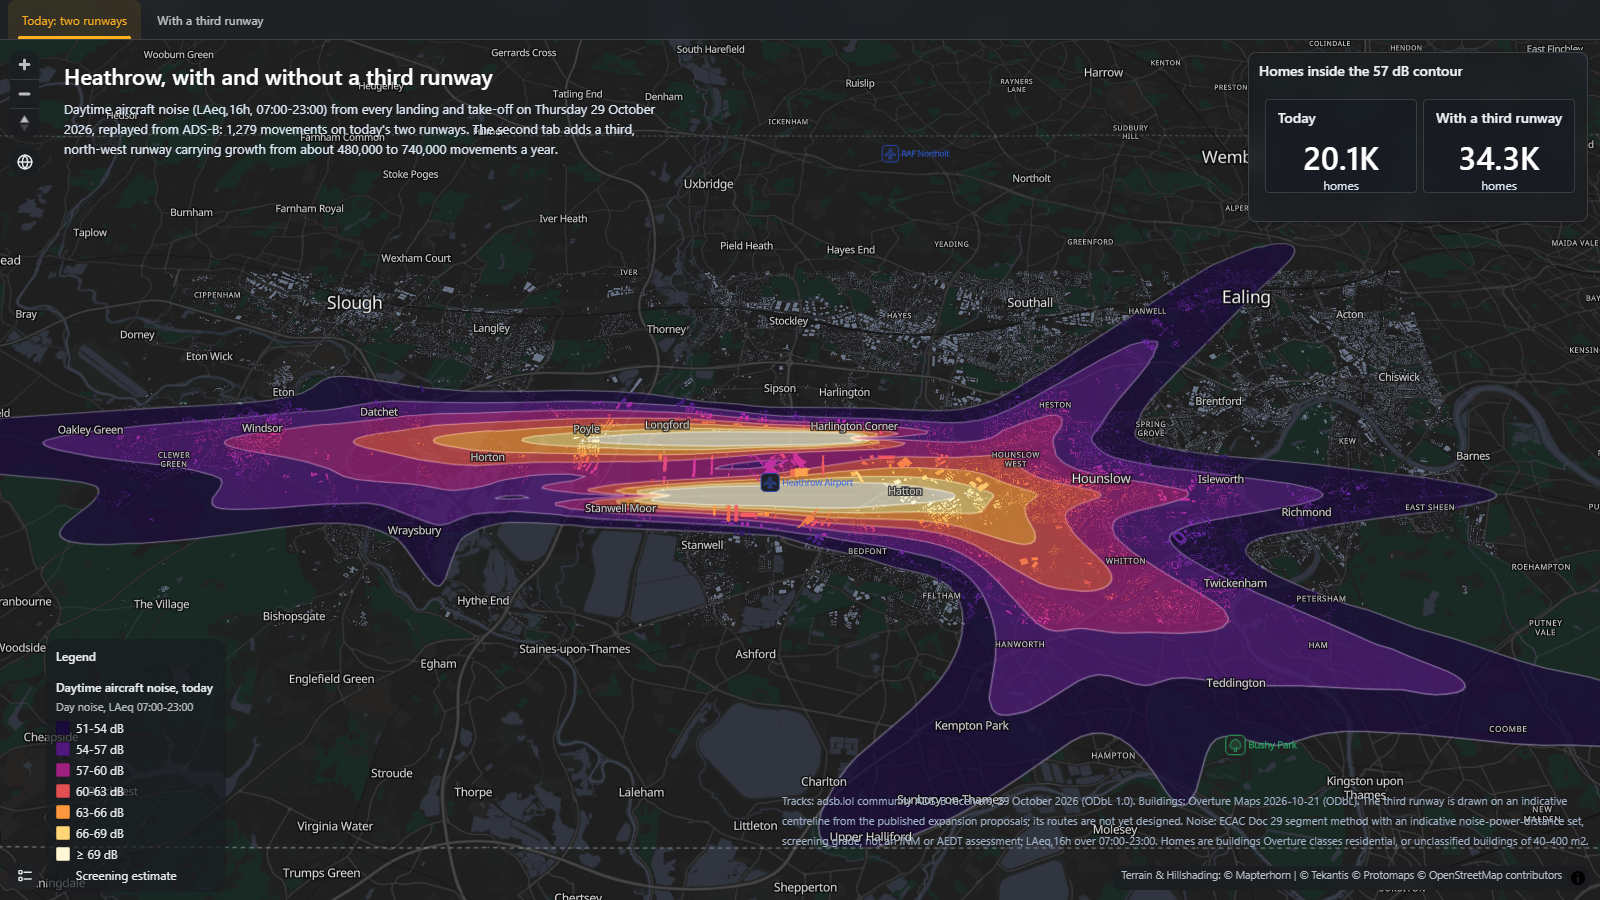
On the day as flown, about 20,100 homes sit inside the 57 dB contour. With the third runway that becomes about 34,300, out of roughly 133,000 homes under the flight paths. Inside the 51 dB contour it goes from about 64,400 to 91,800. Every building is coloured by the noise level it gets, so you can zoom in and see which streets fall inside each band.
Use the tabs along the top of the map to switch between today and the third runway.
How did I build it?
Icon Map for Fabric has a new noise layer. Point it at a table of aircraft position reports and it works out the noise from every flight using the segment method in ECAC Doc 29, the European reference method for airport noise contours, then draws the result as contour bands. It reads the flights straight from the data in the Lakehouse, so the aircraft don't need to be on the map at all, and it can colour another layer, here the buildings, by the noise level at each feature.
The tracks come from a day of community ADS-B data and the buildings from Overture Maps. I built the map itself using Icon Map's MCP service.
How accurate is it?
This is a screening estimate, not a noise assessment. It's a single day rather than the summer average that airports use for their official contours, and the noise each aircraft makes comes from an indicative set of noise-power-distance data, not the certified data in tools like INM or AEDT. Ground effects, buildings shielding each other, reflections and the weather are all left out. As a check, at Farnborough the same method came out about a quarter smaller than the airport's own contours for a similar number of flights, so if anything these contours are likely to be on the small side.
The third runway is even more of a sketch. It sits on an indicative centreline taken from the published expansion proposals, and the extra flights are copies of the day's real flights moved onto it, so they don't follow the routes a real third runway would be designed to fly. Homes are counted as buildings, so a block of flats counts once: residential buildings in Overture Maps, plus unclassified buildings between 40 and 400 m², which are most likely houses.
Sources
Flight tracks: adsb.lol, community ADS-B receivers, 29 October 2026, available under the Open Database License.
Buildings: © OpenStreetMap contributors, Overture Maps Foundation, release 2026-10-21, available under the Open Database License.
Noise method: ECAC.CEAC Doc 29, Report on Standard Method of Computing Noise Contours around Civil Airports, 4th edition.
Terrain: © Mapterhorn.
Base map: © Protomaps, © OpenStreetMap contributors, available under the Open Database License.