

It's day 10 of the 30 Day Map Challenge, and today's theme is prompts.
So for this one I didn't build the map myself. I wrote a prompt, gave it to an AI agent connected to Icon Map's MCP server, and let it build the whole thing in Icon Map for Fabric. Here's the result:
The prompt
This is exactly what I typed, and it was the only prompt: no follow-ups, and nothing set up for it beforehand. No data, no starting map, no layers.
Using the Icon Map MCP server, make my entry for day 10 of the 30 Day Map Challenge. Let's call it "The jet stream, right now."
I want live wind 10 km up as glowing 3D particles floating above a globe, with the jet running across the North Atlantic from North America to Europe, and today's surface pressure underneath as faint isobars with the highs and lows marked. Dark and dramatic, like a magazine cover: a big serif title in the empty sky, a short subtitle, a simple colour key, and "#30DayMapChallenge 2026 · Day 10" in a corner.
Make it look great, not just correct:
- the jet is the obvious hero, and slow air stays in the background
- the land still shows through, enough to tell the two continents apart
- the curve of the Earth shows against the stars, with nothing ugly at the poles
- nothing clipped or overlapping, and no cluttered attribution
Save it to my 30 Day Map Challenge workspace.
What came back
A short while later, the map was sitting in my Fabric workspace.
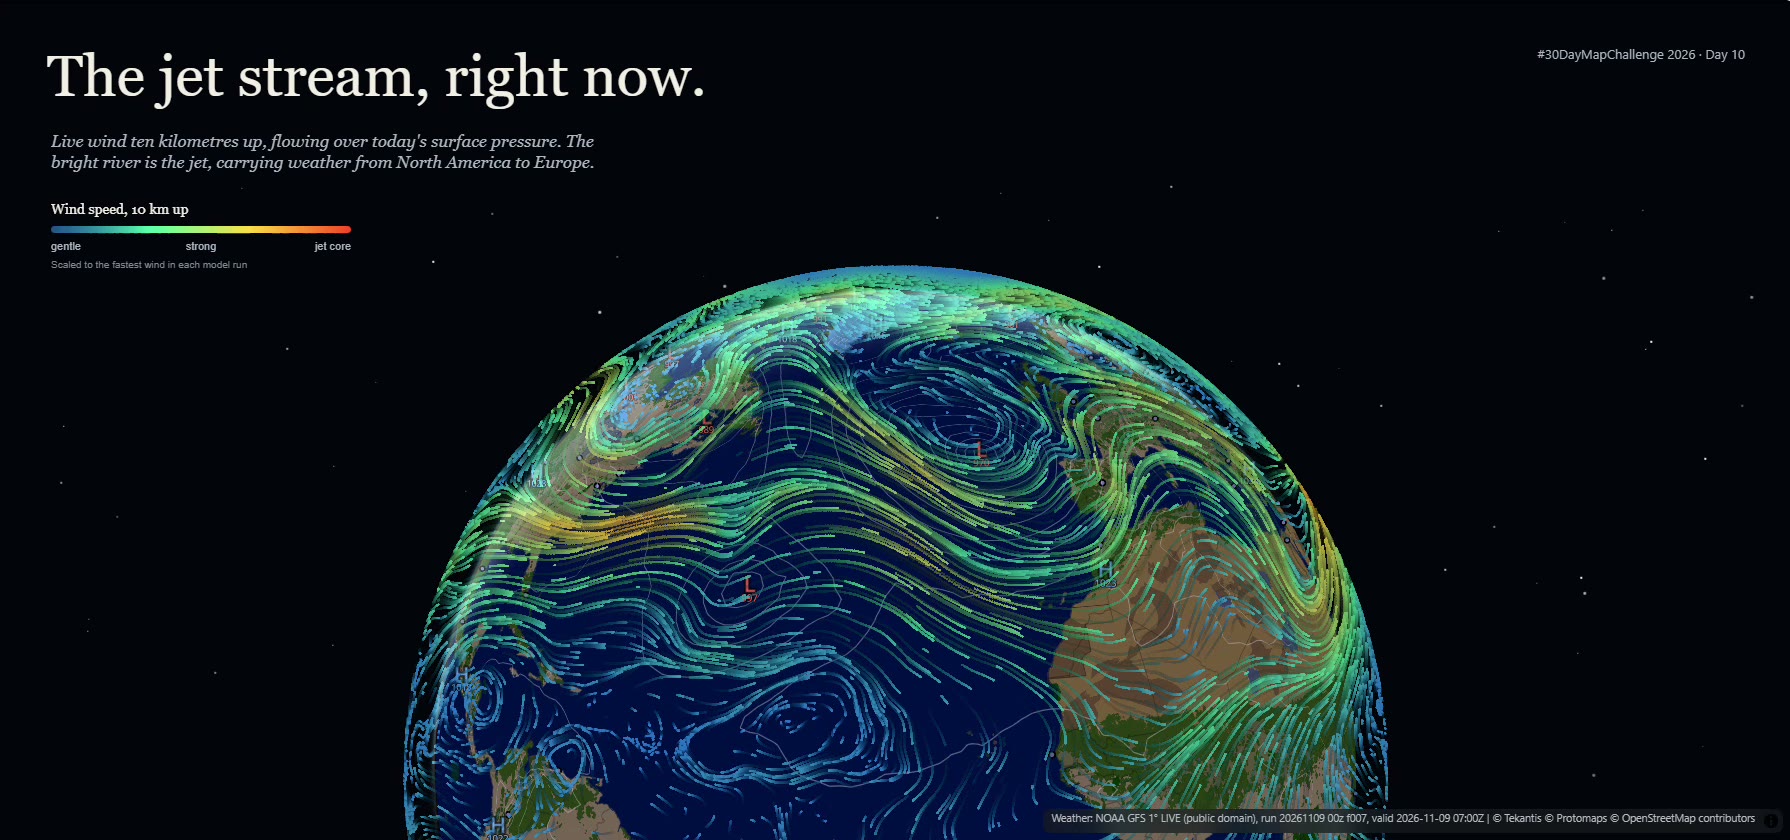
The particles are the wind at 250 hPa, the pressure level where the jet stream usually sits, about ten kilometres up. It's live data from NOAA's GFS weather model, and the particles float at that height above the globe rather than lying on the surface. The faint grey lines underneath are today's surface pressure, as isobars every 4 hPa, with the highs and lows marked.
The agent tilted the globe so the curve of the Earth shows against the stars and the poles drop behind the horizon. It also thinned out the particles and gave them long trails, so the fast-moving jet draws long, bright streaks while the slower air stays in the background.
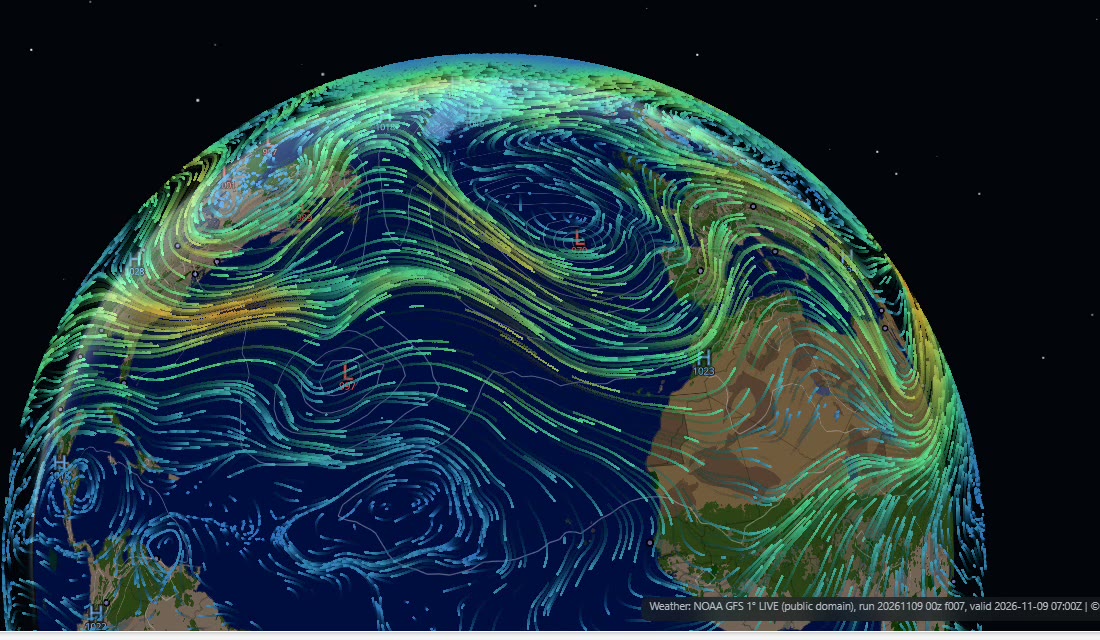
On the morning I made it, the jet was leaving the east coast of the United States and heading out across the Atlantic. The fastest wind over the Atlantic was about 150 mph, just north-east of Bermuda, and there was a deep 970 hPa low in the north-east Atlantic.
The "right now" in the title is literal. The map doesn't store a snapshot: it loads the latest model run every time it opens, and GFS updates every six hours, so if you open it tomorrow the jet will be somewhere else.
How did it build it?
Icon Map's MCP server gives an AI agent a set of tools for working with Icon Map for Fabric. There's a guide for every kind of layer, a validator for the map configuration, a headless preview that renders the map exactly as the real viewer does, a tool that writes the "About this map" report, and one that saves the map to a Fabric workspace.
The preview is the important one. The agent doesn't just write a configuration and hope: it renders the map, looks at the picture, and fixes what's wrong. Along the way it tested three different camera framings, reframed the globe when the colour key collided with its edge, and checked the map at two screen sizes. When it had saved the map, it read it back from the workspace to make sure it matched what it had previewed.
Here's the live map. It loads the latest model run each time, so the jet won't be quite where it is in the pictures above.
Sources
Wind and surface pressure: NOAA Global Forecast System (GFS), public domain, read live from the NOAA Open Data Dissemination program on AWS.
Basemap: © Protomaps © OpenStreetMap contributors.