

And we're back for the 30 Day Map Challenge 2026. This is the third year I've participated and the last 2 times, I managed to get a map out every day of the month each year - so I will do my best again this time.
Each year, I've used our latest product to create the map. Year one it was Icon Map Pro, last year was Icon Map Slicer. This year I'm going to use Icon Map for Fabric. Check out Antony's posts as he's also taking part this year and building them in Power BI with Icon Map Pro.
The theme for day one is Points. I've actually built the same map as last year. I used data from the Greater London Authority to plot every (public realm) tree in London. There has been an update since last year's map, so I took the latest available data.
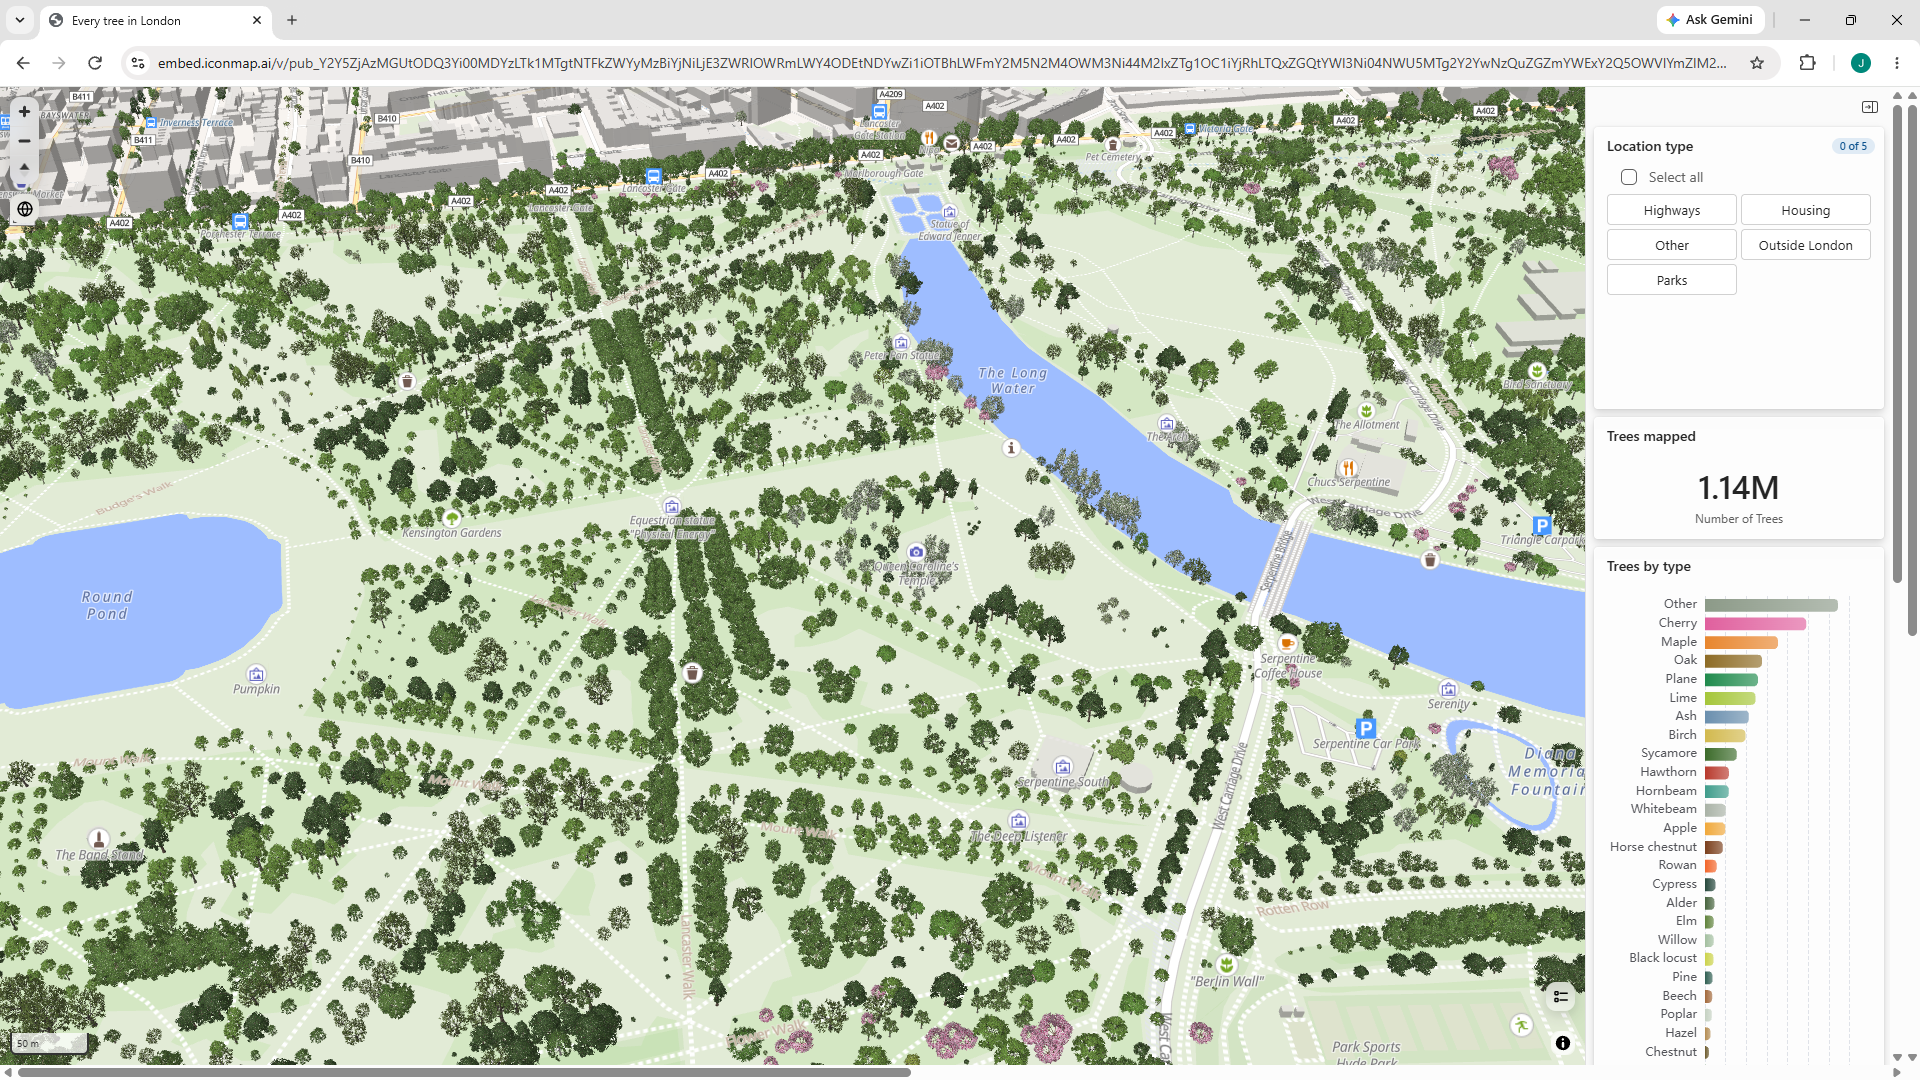
The challenge last year was the amount of the data, with over a million trees across London, and hundreds of thousands in each borough, I had to limit the map to only viewing one borough at a time. With Icon Map for Fabric, I've been able to plot all the trees in one go. In the public facing map, it takes a few moments to download the data - the private map, is a bit quicker.
Zoom in and you actually see each individual tree. Icon Map Catalog has a repository of thousands of map layers, but it also has hundreds of 3D models that can be added to maps, so I used these models to show the individual trees when you zoom in. The models width and height is configured based on the height of the tree and the width of it's canopy from the data.
So we're not rendering millions of 3D models, the data source is set to automatically just stream the points in the current map view.
I also added a slicer and some interactive charts in the pane on the right.
Here's the resulting map if you'd like to have a play with it.