North America Location Data for Power BI

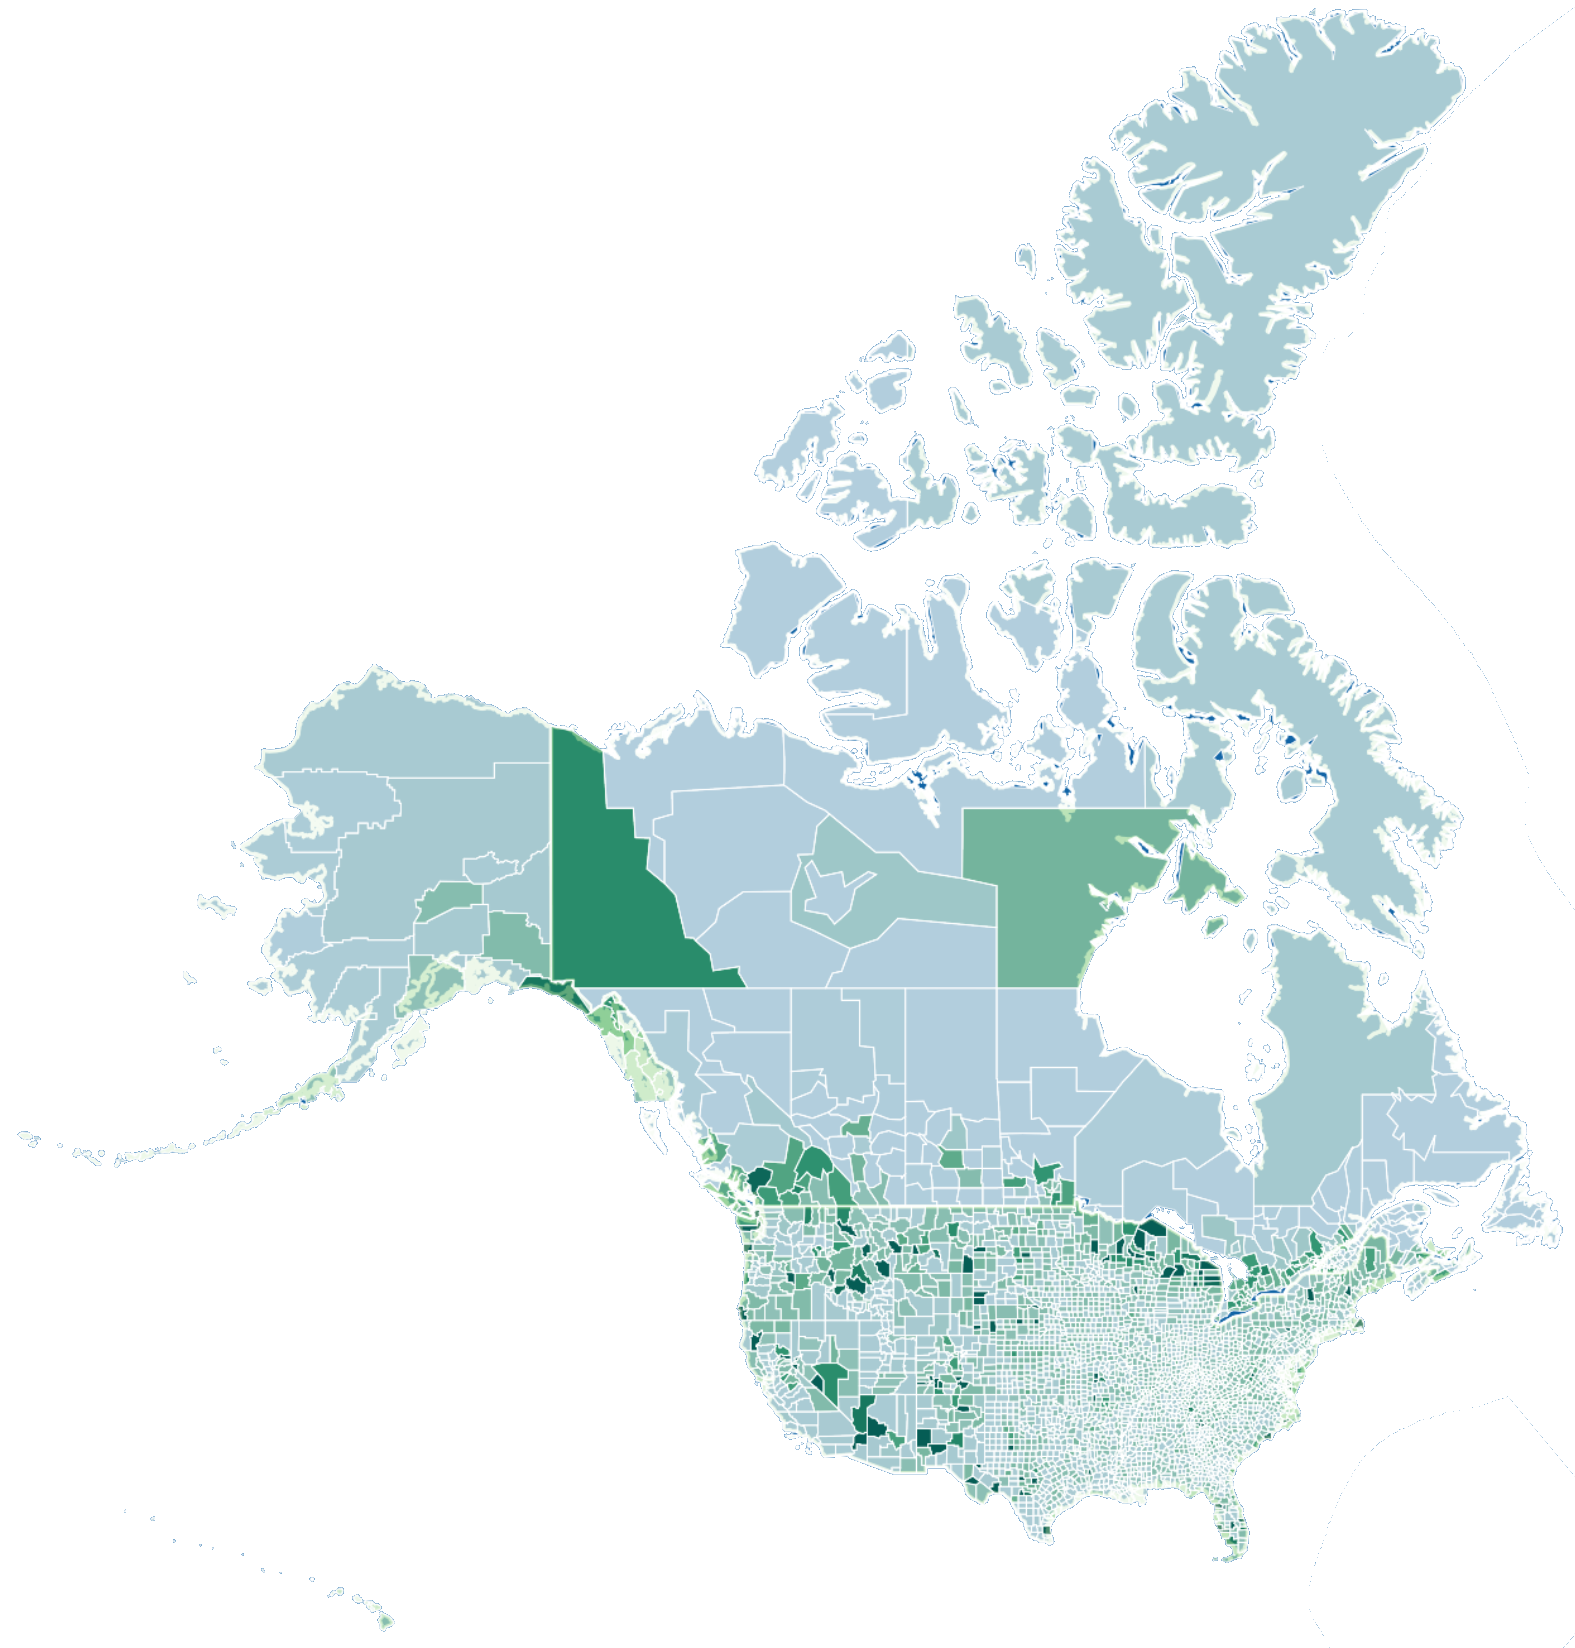
Comprehensive geographic, demographic, economic and environmental data for the United States and Canada.

Bring authoritative US and Canadian data into Power BI with Icon Map Pro and Icon Map Slicer. From national context to neighbourhood insight, combine rich location intelligence with your own business data.

North America catalog map
128+ layers Authoritative North America datasets
Cloud native Streamed from the cloud, always up to date
Seamless in Power BI Bind, visualise and filter in seconds

What's in the North America catalogue?

Curated datasets from trusted government and open data sources. All ready to style, filter and bind to your Power BI data.

Administrative & Statistical Geographies

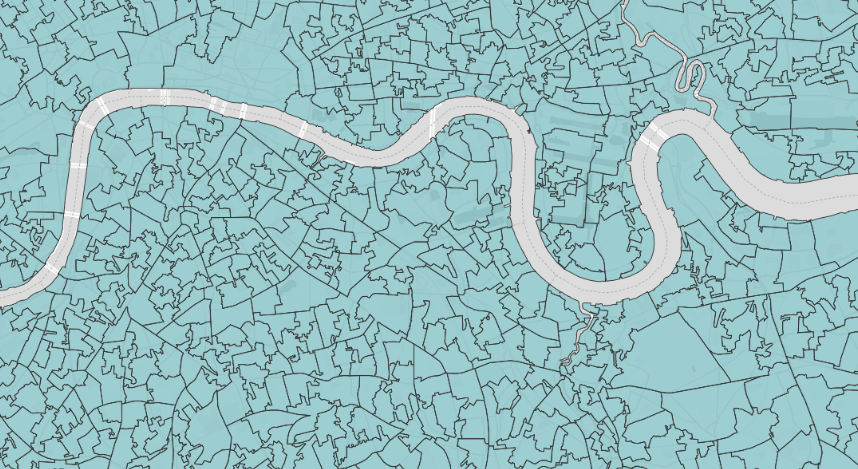
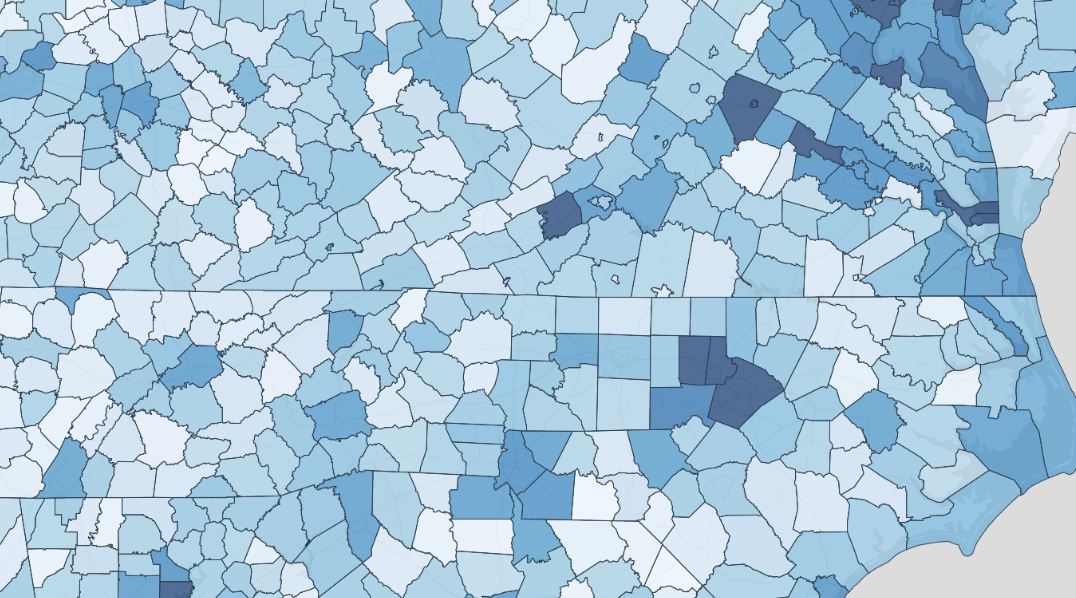
Country, region, county, local authority, census tract and statistical boundaries.

Example layers

  • Canada - Census Tracts (2021 Census)
  • USA - Combined Statistical Areas (CSA) (2024)
  • USA - County Subdivisions (Townships / MCDs) (2024)
  • Canada - Dissemination Areas (2021 Census)
View layers →

Demographics & Population

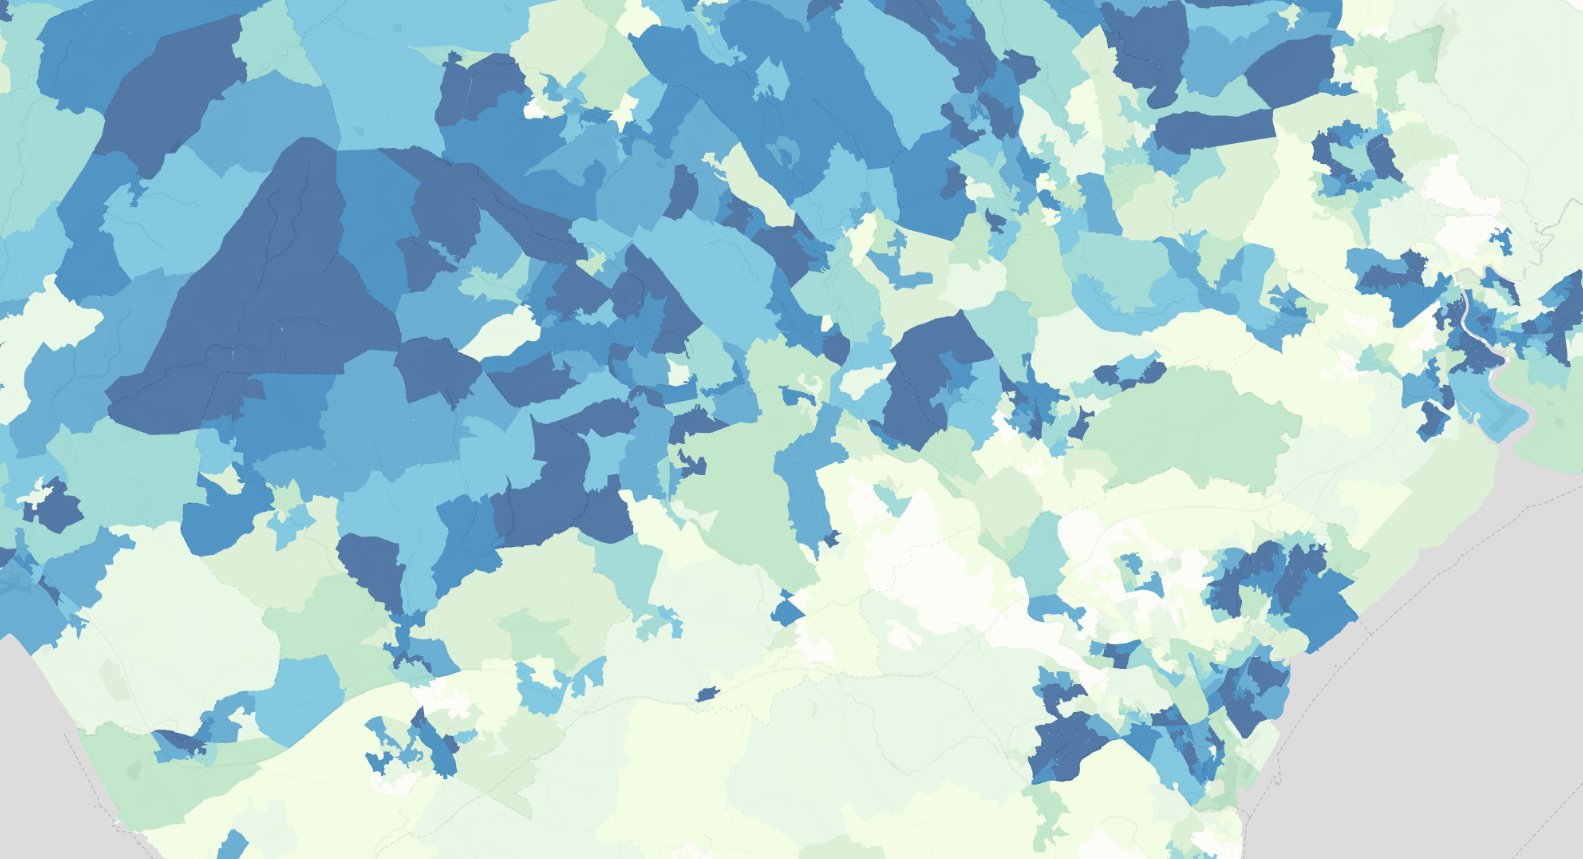
Population counts, age, ethnicity, household composition and census attributes.

Example layers

  • USA - American Community Survey - Age & Sex (2019–2023)
  • USA - American Community Survey - SNAP / Food Stamp Receipt (2019–2023)
  • USA - American Community Survey - Household Income (2019–2023)
  • USA - American Community Survey - Commute Mode & Time (2019–2023)
View layers →

Economy, Jobs & Business

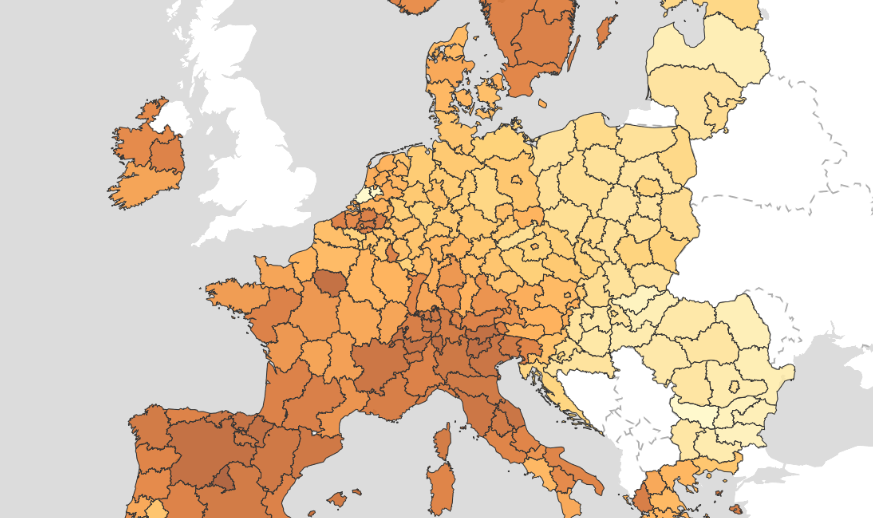
GDP, employment, wages, industry, businesses and consumer markets.

Example layers

  • USA - LEHD LODES Workplace Jobs by Block Group (2022)
  • USA - BEA County Personal Income (2024)
  • USA - BEA County GDP (2024)
  • USA - LEHD LODES Resident Workers by Block Group (2022)
View layers →

Housing, Property & Planning

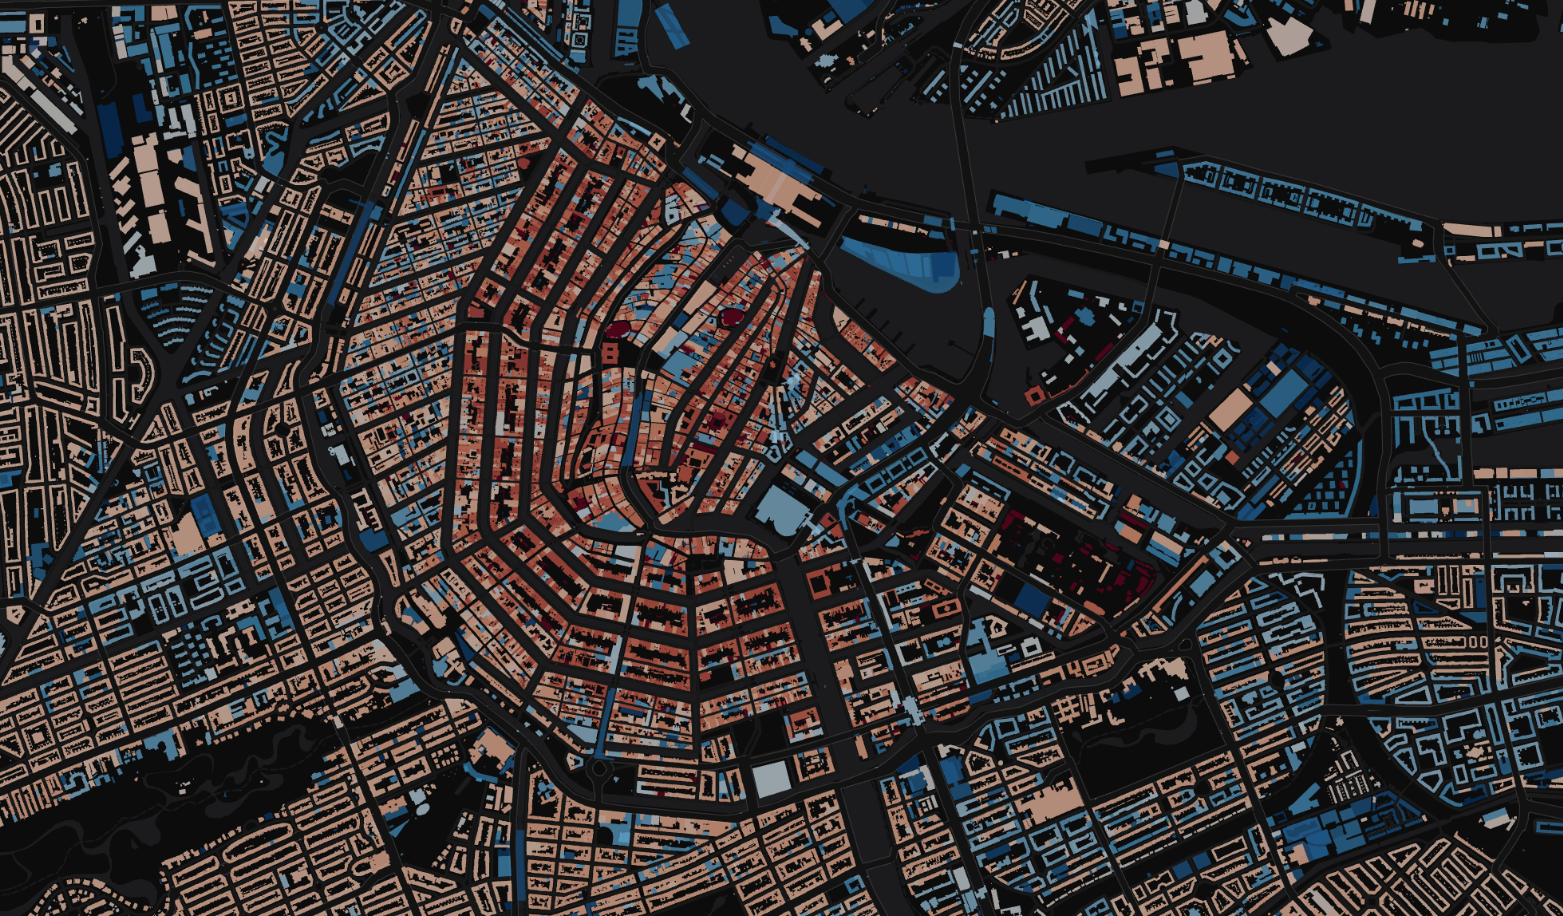
Housing stock, affordability, parcels, building footprints and local planning.

Example layers

  • USA - FEMA USA Structures
  • USA - HUD Housing Choice Vouchers by Tract
  • USA - HUD CHAS Housing Affordability by County
  • USA - HUD Location Affordability Index (v3, 2017)
View layers →

Environment, Nature & Climate

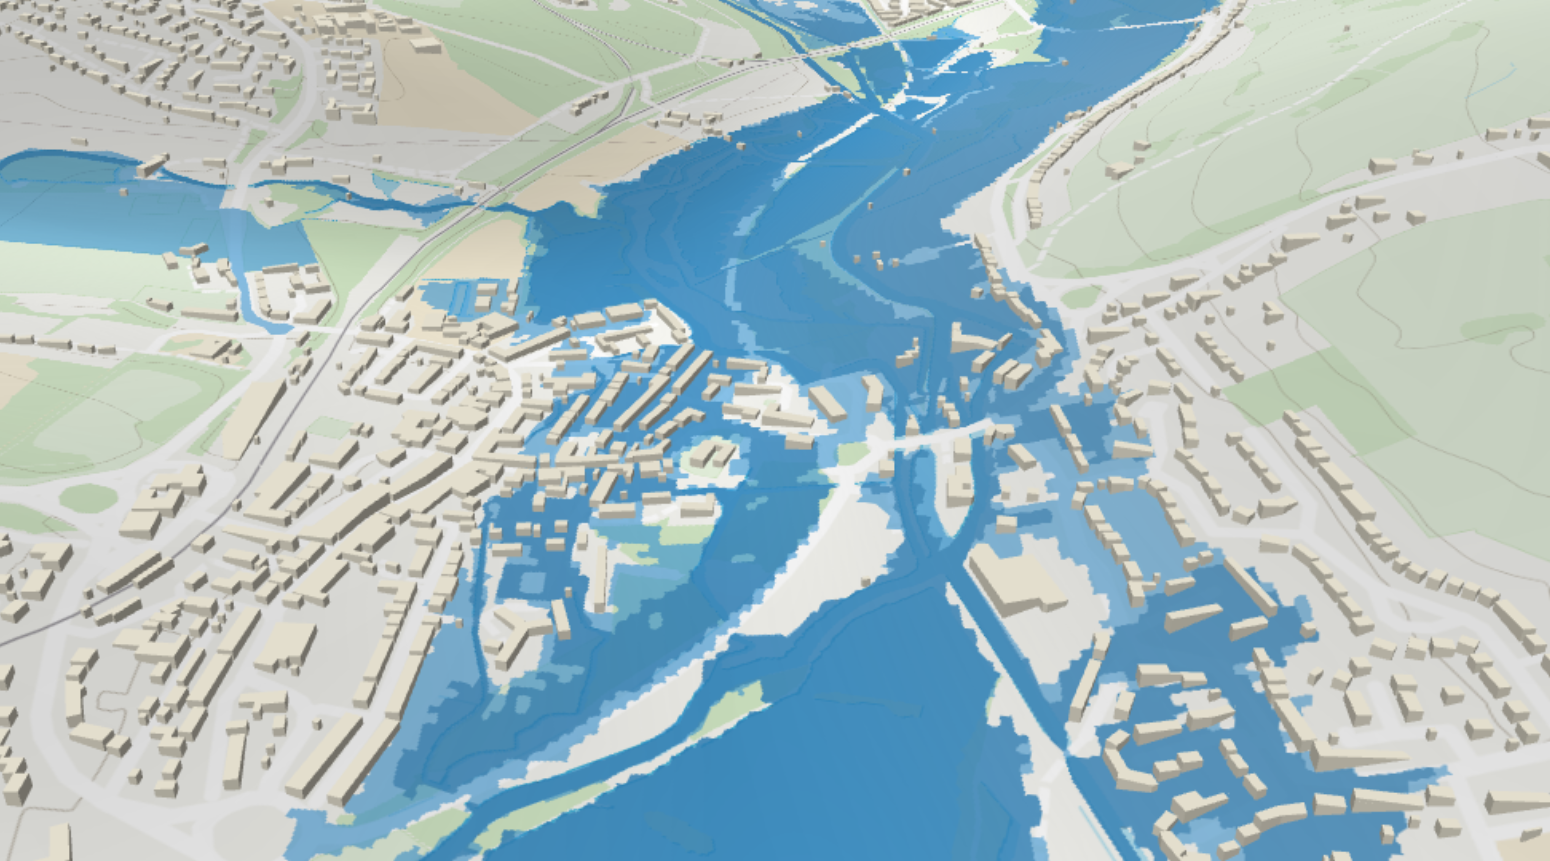
Habitats, ecology, soils, climate, air quality, flood and natural risk.

Example layers

  • USA - FEMA National Risk Index: Wind & Storm Hazards (2025)
  • USA - EPA EJScreen Environmental Justice Indicators (2024)
  • Canada - NRCan Wind Turbines
  • USA - FEMA National Risk Index: Flood Hazards (2025)
View layers →

Transport, Mobility & Infrastructure

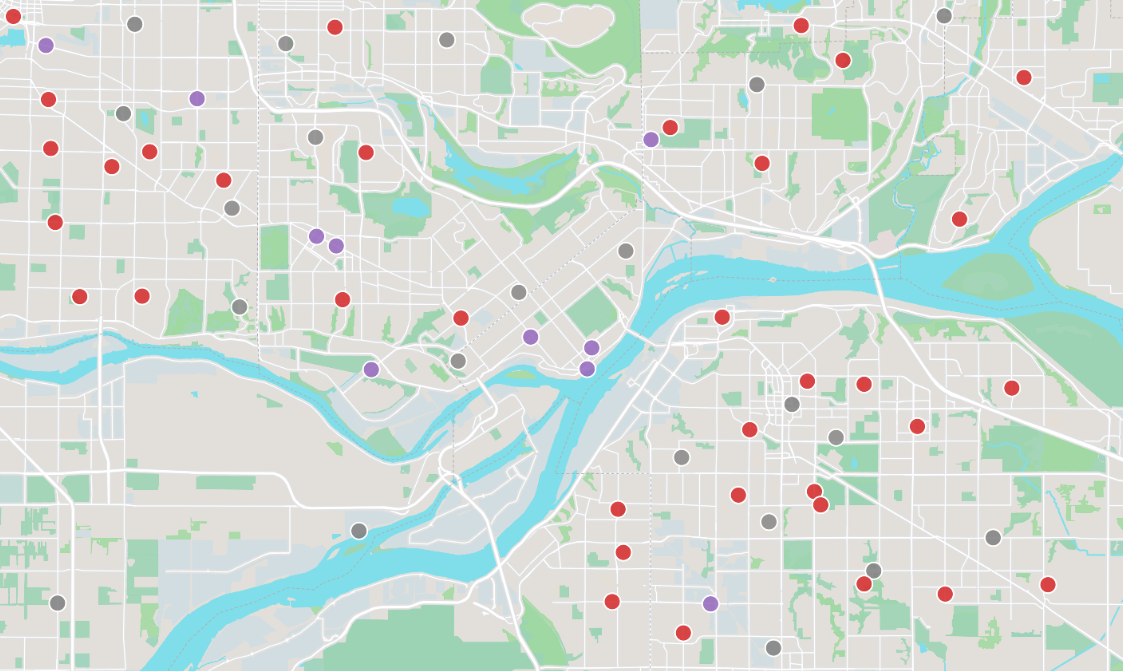
Roads, rail, airports, public transport, EV charging and mobility analytics.

Example layers

  • USA - TIGER Primary & Secondary Roads (2024)
  • USA - American Community Survey - Geographic Mobility (2019–2023)
  • USA - US Railroads
  • USA - MARTA Transit Routes – Atlanta, Georgia
View layers →

Health & Wellbeing

Healthcare boundaries, public health indicators and care services.

Example layers

  • USA - CDC PLACES Health Outcomes (2024)
  • USA - American Community Survey - Disability (2019–2023)
  • Canada - Healthcare Facilities (ODHF)
  • USA - USDA Food Access Research Atlas (2019)
View layers →

Education & Civic

Schools, education attainment, electoral districts and public-sector boundaries.

Example layers

  • Canada - Recreational and Sport Facilities (ODRSF)
  • USA - Secondary School Districts (2024)
  • Canada - Cultural and Art Facilities (ODCAF)
  • USA - Elementary School Districts (2024)
View layers →

Reference, Basemaps & Place Names

Place names, gazetteers, topography, contours and general reference layers.

Example layers

  • Canada - CanVec Dams
  • Canada - StatCan Open Database of Buildings
View layers →

What can you build?

Real-world analyses you can power with North America catalog layers in Power BI.

Market & Territory Planning

Understand your markets, customers and opportunities at any geography.

Site Selection & Expansion

Find the right locations using demographics, economic and infrastructure data.

Risk & Resilience Analysis

Assess environmental, health and climate risks to protect people and assets.

Mobility & Accessibility

Analyse movement patterns and accessibility to services and infrastructure.

Program & Policy Impact

Target programs, measure impact and drive better outcomes for communities.