The Goal
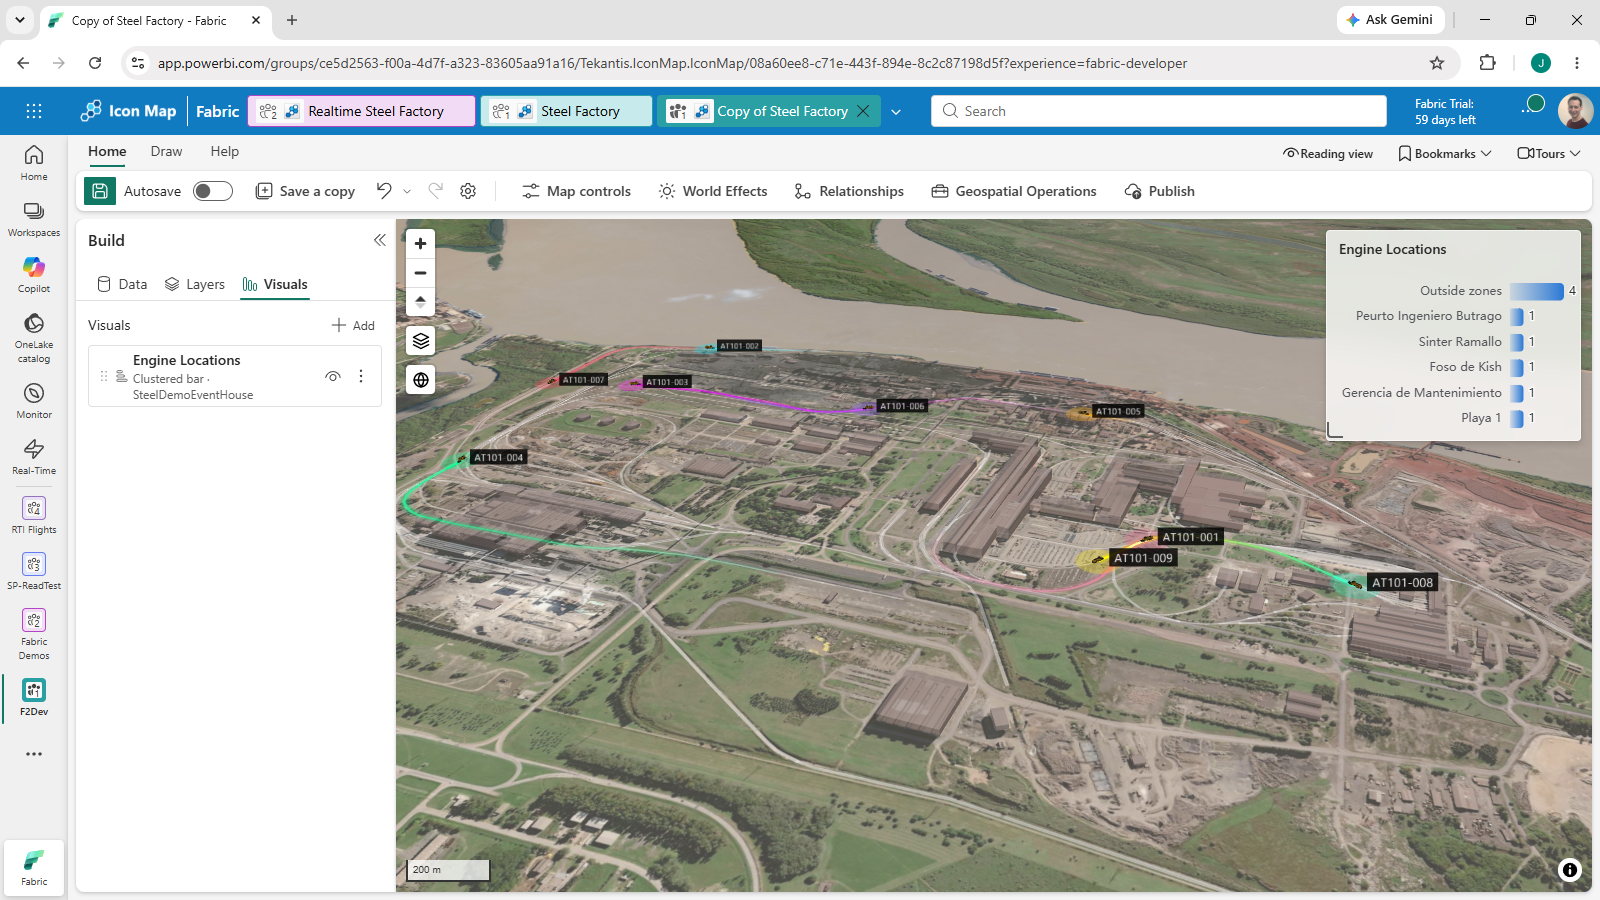
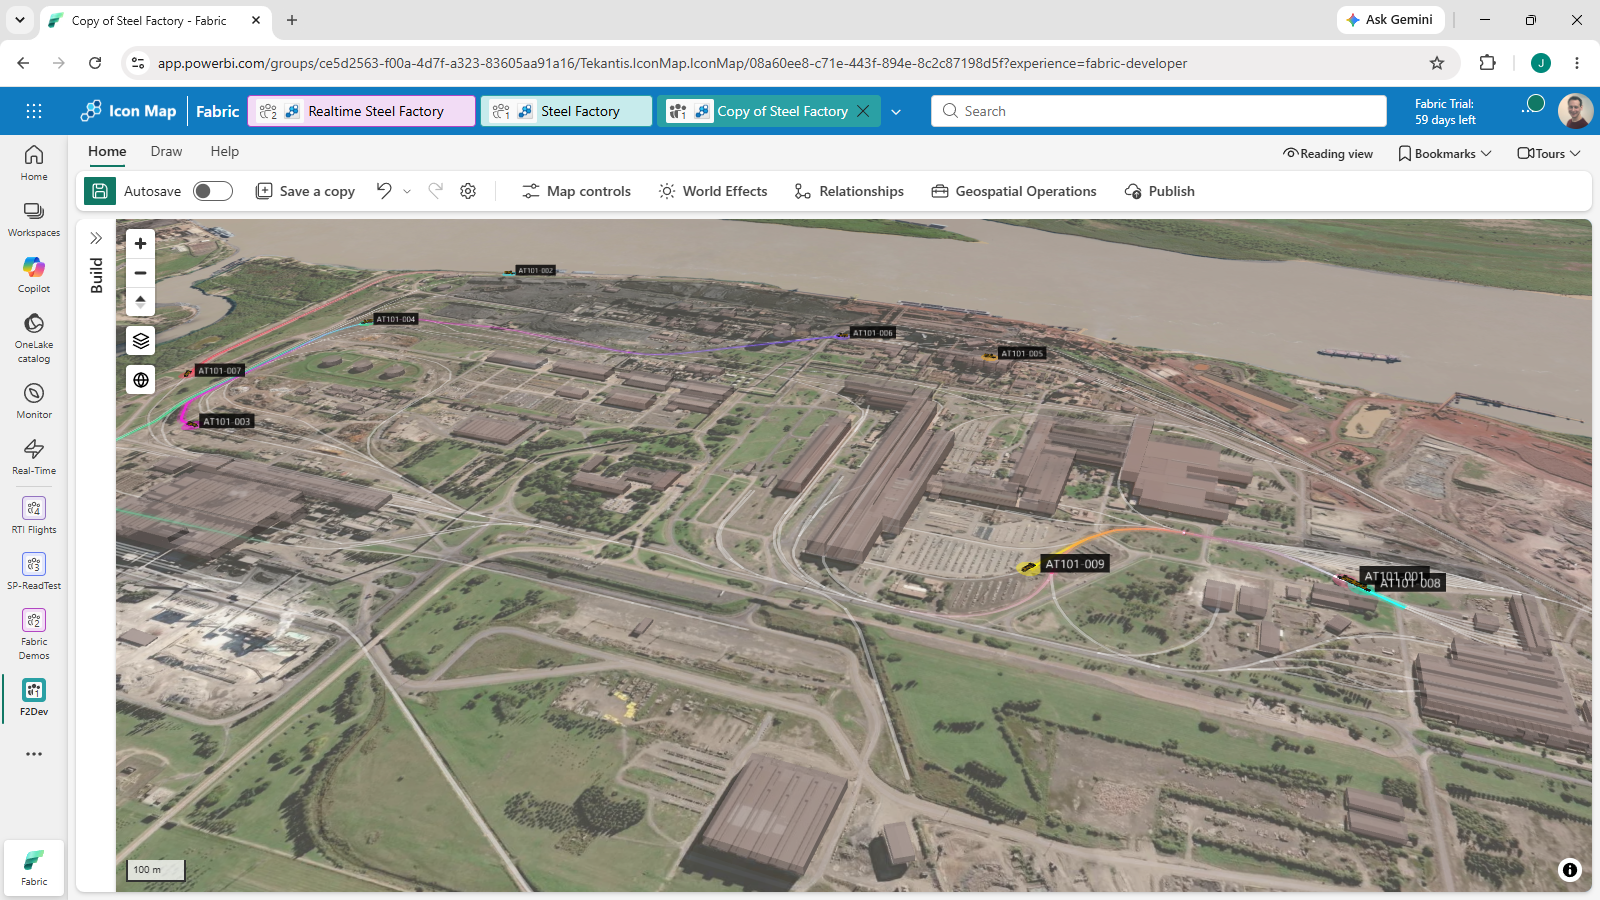
The idea of this map was to track trains moving around a the site of a large steel factory in South America. The engines have a tracker that transmits their location every 30 seconds, so the idea was to show the locations on the map, and show the movement between updates.
Ingesting Data
Within Fabric we opted to use the Realtime Intelligence workload with a custom endpoint on Event Stream to push the engine locations into a KQL Database in Event House.
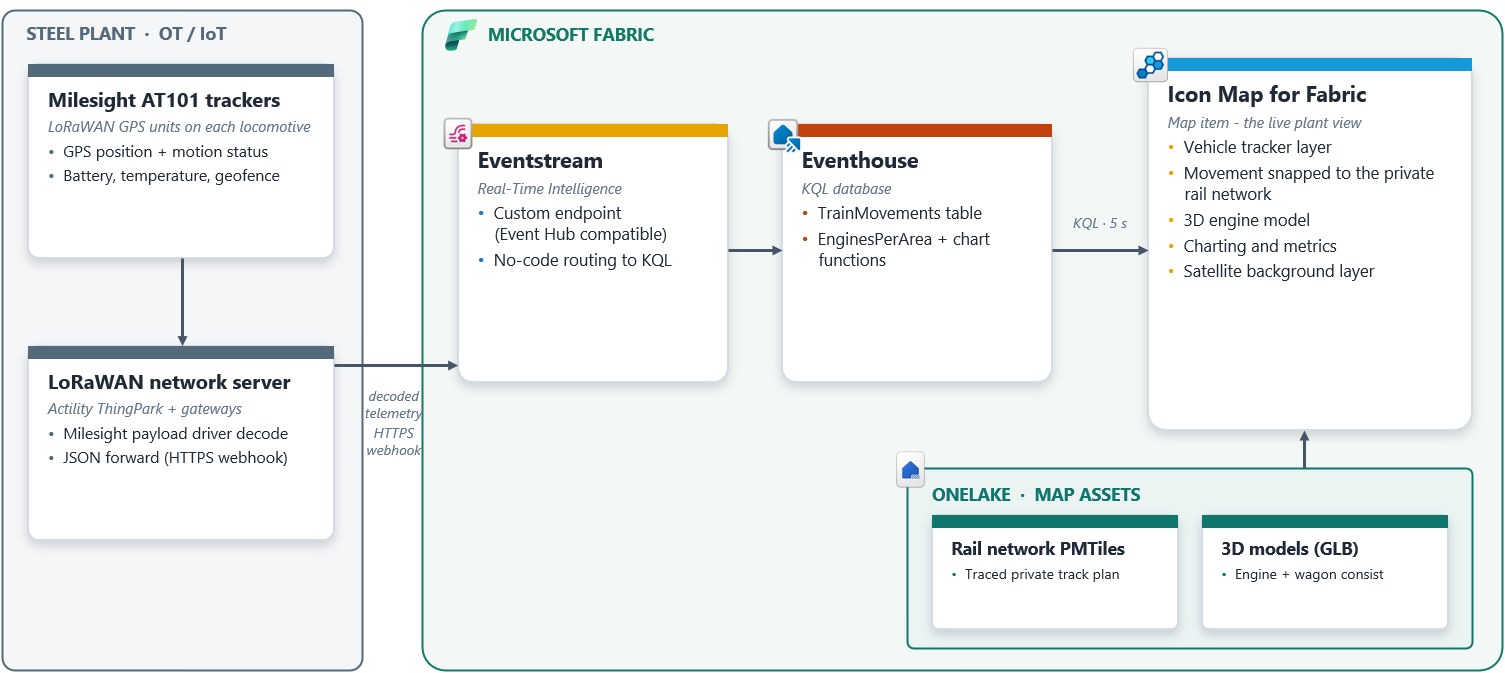
With this simple architecture enabled, we have growing table of data containing a growing history of train movements.
Adding the data to Icon Map
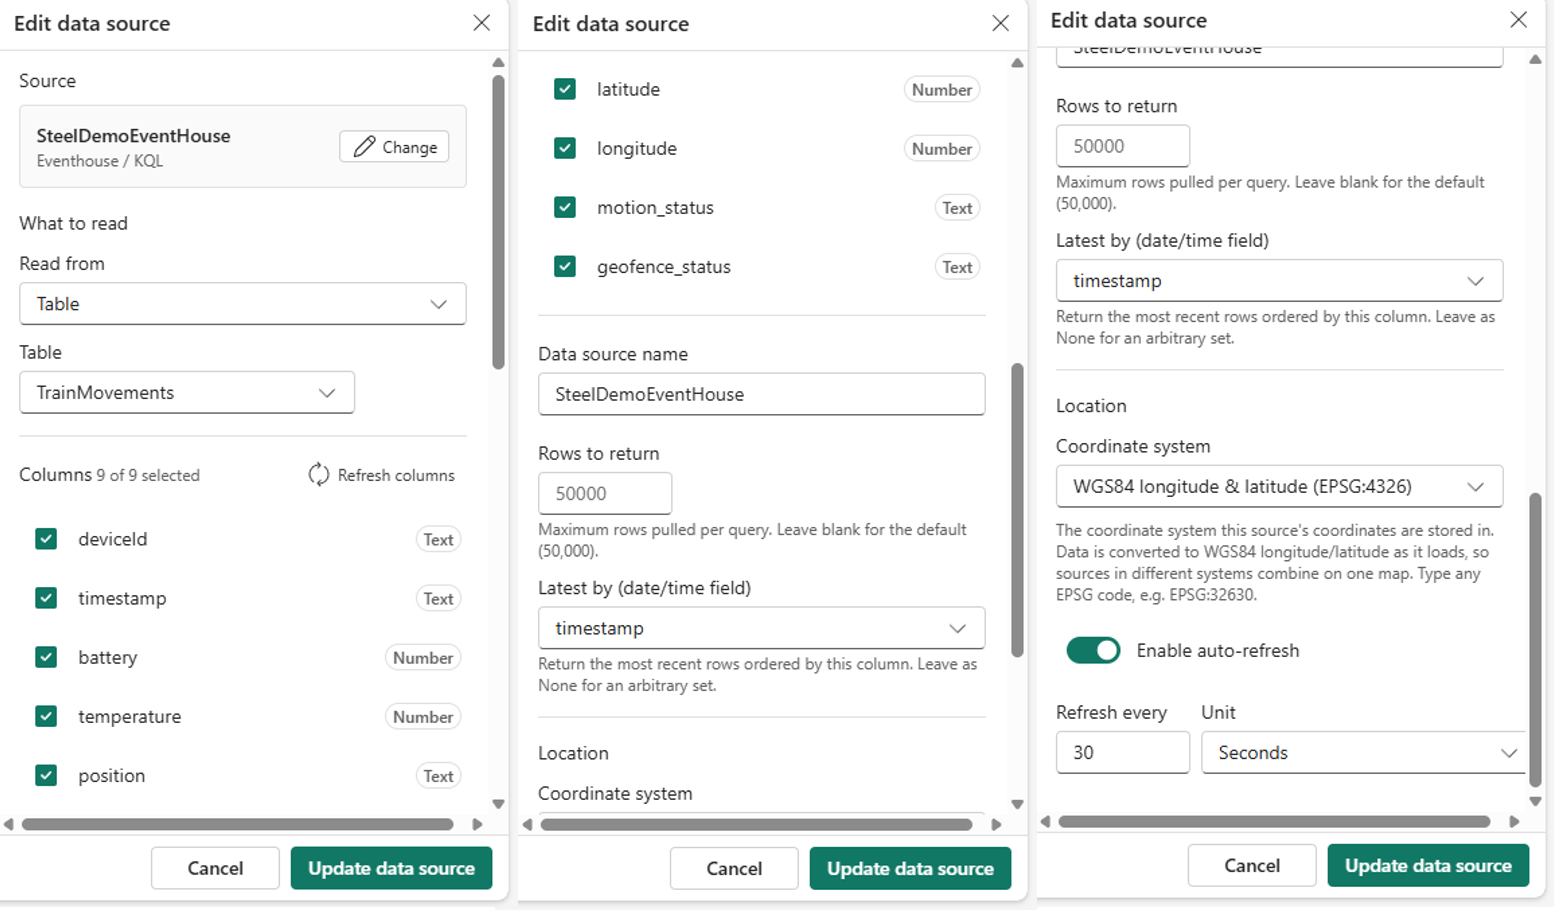
Icon Map for Fabric has built in support for KQL databases, so bringing the train data into Icon Map was just a few clicks. I configured the data to refresh every 30 seconds, and to return the most recent 50,000 rows of data based on the timestamp field.
Showing the trains on the map
I then used Icon Map's vehicle tracker layer type bound to the KQL data source. I used AI to generate a 3D model of the steel factory's railway engine to add as a custom model for the layer. I enabled the option to show the last 5 minutes of movement as a trail behind the trains. I then enabled the projected movement of the trains so they appear to move along the track, rather than jumping every 30 seconds.
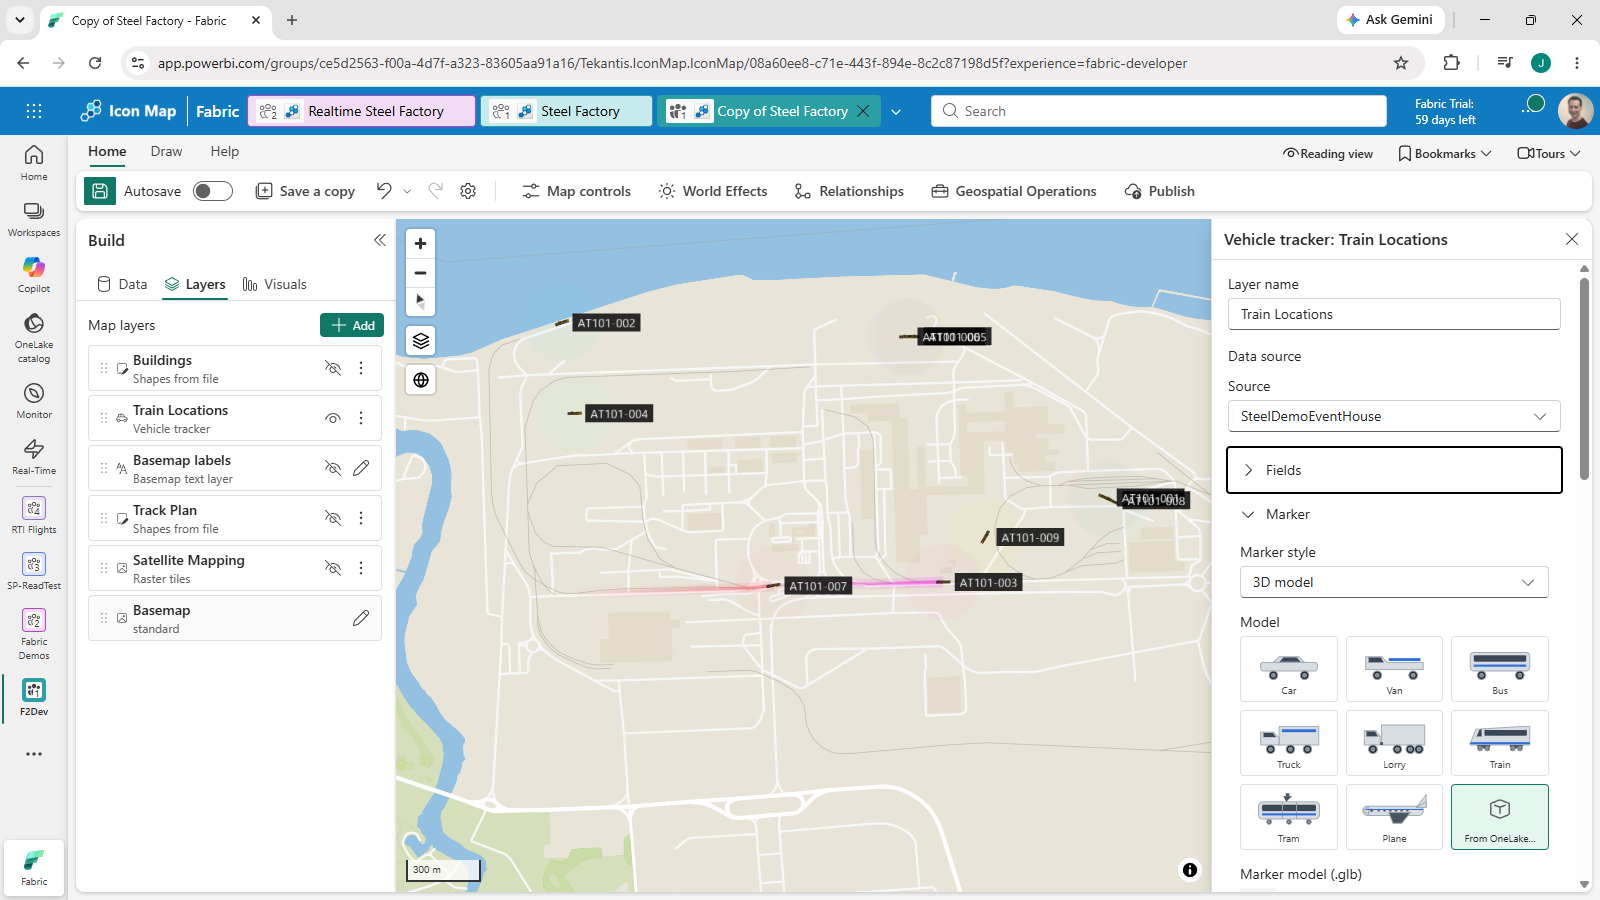
By default, the vehicle tracker layer will use the transport layers in OpenStreetMap to snap vehicles movements along the network, so that they animate around curves in the track. However, it quickly became clear that the base map only had a small subset of the actual railway tracks in use. Fortunately, Icon Map enables you to use a custom layer as the transportation network.
Creating the transportation network
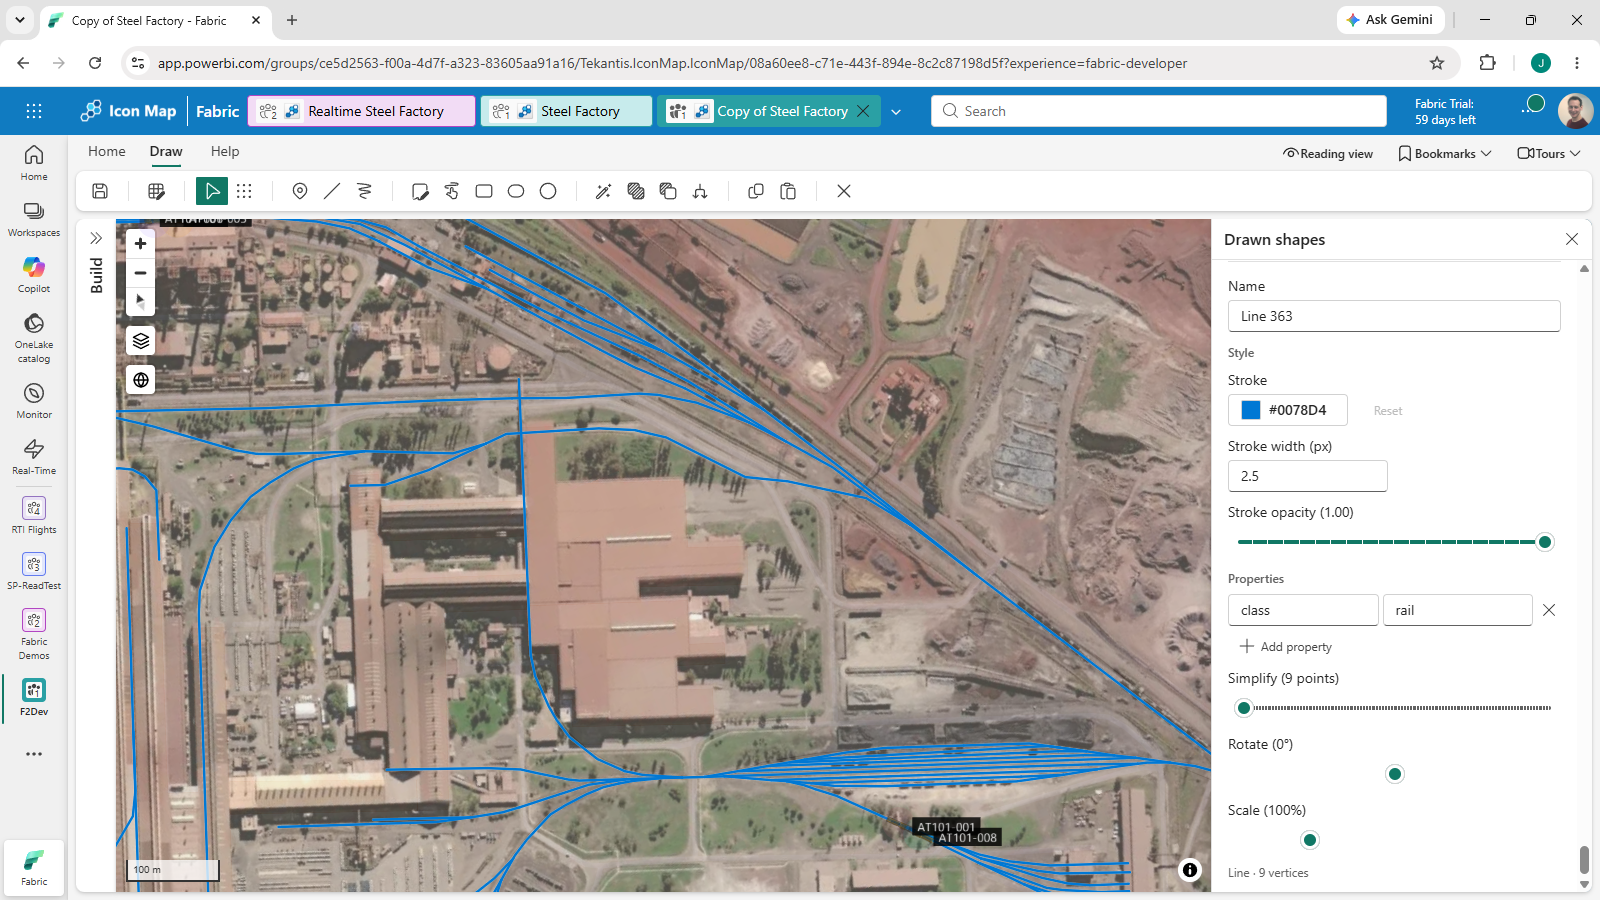
To create the network of tracks, I added a satellite raster layer which showed the route of the railway. It was still quite unclear, so rather than use AI, I thought it safest to trace the tracks manually. I used the in-built drawing tools in Icon Map to create linestrings for each of the track segments. I used the snapping tool to ensure that sections of tracks correctly joined.
This was then saved to the map as a layer, and used as the routing layer for the vehicle tracker layer.
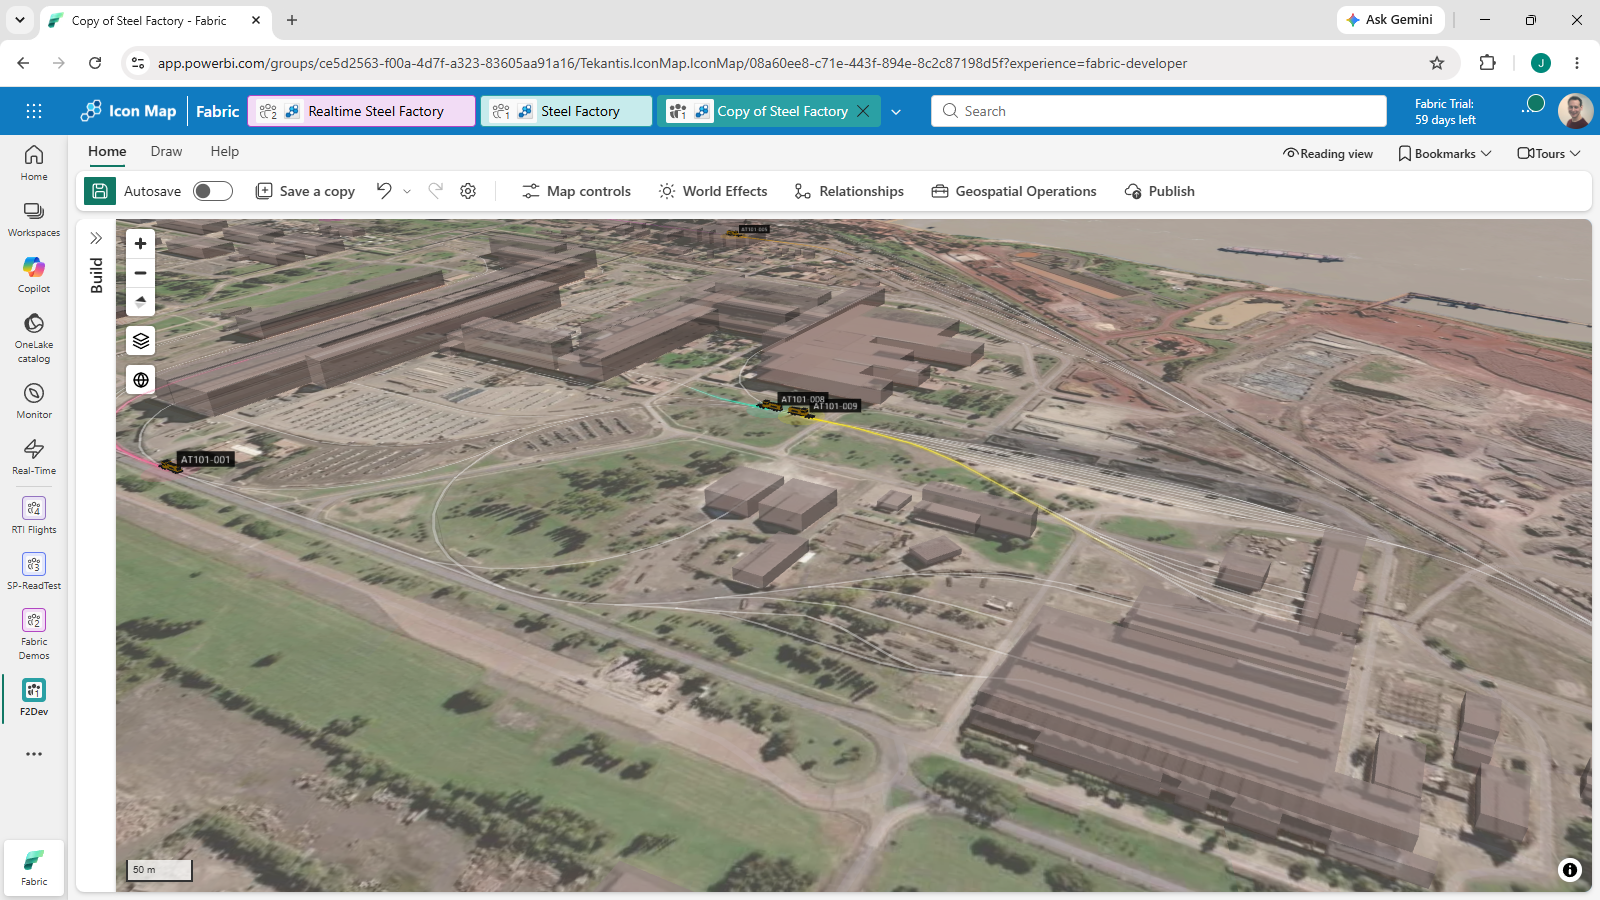
I also added as another layer, 3D extruded blocks representing many of the buildings.
Charting
The tracking system also returns the a geo-fenced area when the trains are in certain areas, so I also added a bar chart to show how many vehicles were present in each of the different regions of the steel plant.