
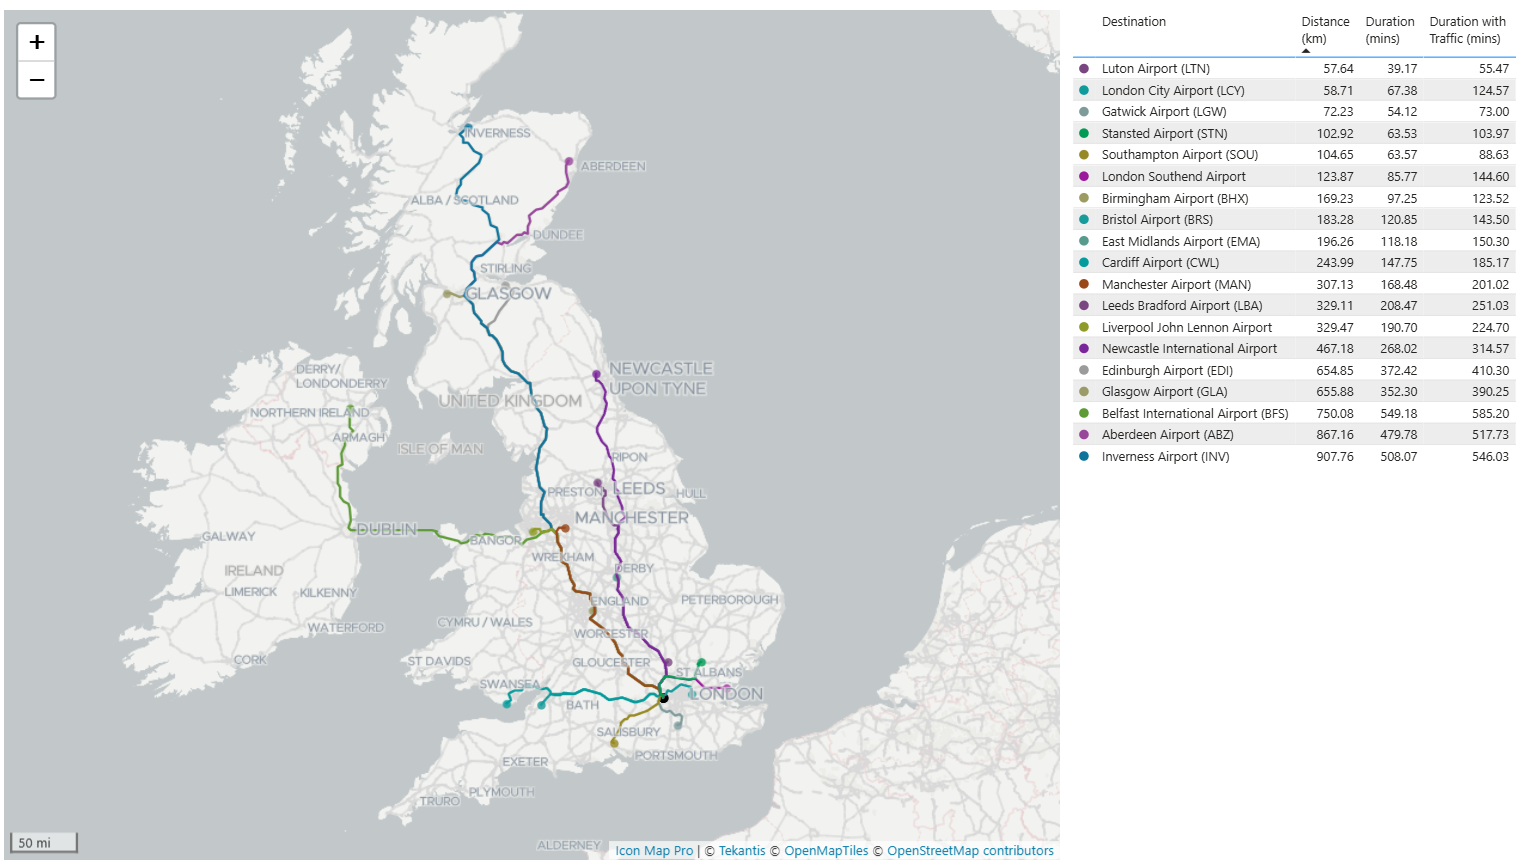
Yesterday I published a blog about drawing drive time isochrones on the map using the Azure Maps API called from PowerQuery, all inside of Power BI. Today I've built a similar report, but this time I'm calling the Azure Maps routing API to draw the routes by road between Heathrow Airport and a number of the UK's other major airports.
While Icon Map Pro has built in options for drawing lines (straight, curved or geodesic) as well as linestrings from GeoJSON or well-known text (WKT), it can't currently draw lines following the best path along roads. This isn't something that can be handled in the presentation layer, especially if traffic, low bridges, width restrictions, etc. are to be taken into account.
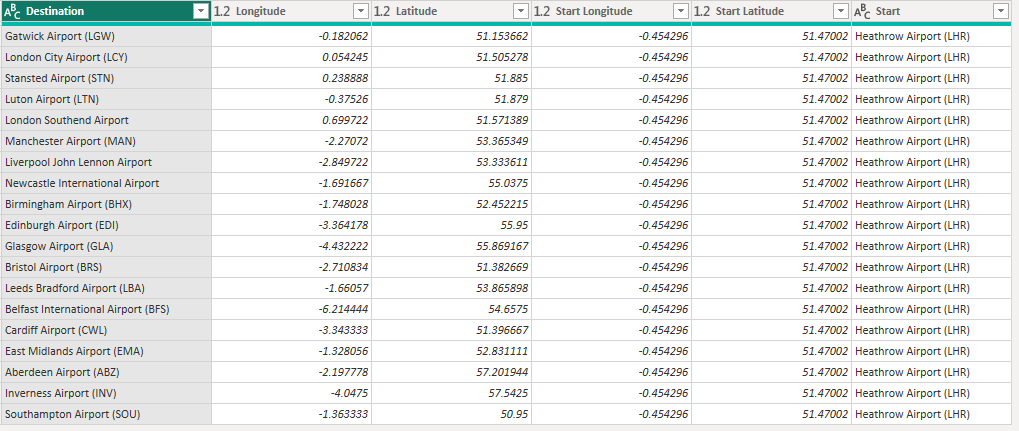
On this basis, the Azure Maps API seems like a great way to handle this. I've started with a simple table of source and destination locations, from which I call the API.
To do this I created a PowerQuery function:
let
    GetRouteDirections = (apiKey as text, sourceLon as number, sourceLat as number, destLon as number, destLat as number) =>
    let
        // Define the API endpoint
        url = "https://atlas.microsoft.com/route/directions?api-version=2024-07-01-preview&subscription-key=" & apiKey,

        // Construct the request body
        requestBody = Json.FromValue([
            type = "FeatureCollection",
            features = {
                [
                    type = "Feature",
                    geometry = [
                        coordinates = {sourceLon, sourceLat},
                        type = "Point"
                    ],
                    properties = [
                        pointIndex = 0,
                        pointType = "waypoint"
                    ]
                ],
                [
                    type = "Feature",
                    geometry = [
                        coordinates = {destLon, destLat},
                        type = "Point"
                    ],
                    properties = [
                        pointIndex = 1,
                        pointType = "waypoint"
                    ]
                ]
            },
            optimizeRoute = "fastestWithTraffic",
            routeOutputOptions = {"routePath"},
            maxRouteCount = 1,
            travelMode = "driving"
        ]),

        // Convert the JSON request body to binary format
        requestBodyBinary = requestBody,

        // Make the API call
        response = Web.Contents(url, [
            Headers = [
                #"Content-Type" = "application/json"
            ],
            Content = requestBodyBinary
        ]),

        // Parse the JSON response
        json = Text.FromBinary(response)
    in
        json
in
    GetRouteDirections
This returns a lot of information, so I created a function to extract out the lines making up the route, as well as the length and durations.
let
    ExtractMultiLineString = (responseText as text) =>
    let
        // Parse the response text into a JSON object
        jsonResponse = Json.Document(responseText),

        // Access the 'features' array in the JSON response
        features = jsonResponse[features],

        // Filter the features to find the one with geometry.type = "MultiLineString"
        multiLineStringFeature = List.First(List.Select(features, each _[geometry][type] = "MultiLineString"), null),

        // Extract additional properties
        distanceInMeters = if multiLineStringFeature = null then null else multiLineStringFeature[properties][distanceInMeters],
        durationInSeconds = if multiLineStringFeature = null then null else multiLineStringFeature[properties][durationInSeconds],
        durationTrafficInSeconds = if multiLineStringFeature = null then null else multiLineStringFeature[properties][durationTrafficInSeconds],

        // Convert duration to minutes
        durationInMinutes = if durationInSeconds = null then null else Number.Round(durationInSeconds / 60, 2),
        durationTrafficInMinutes = if durationTrafficInSeconds = null then null else Number.Round(durationTrafficInSeconds / 60, 2),

        distanceInKm = if distanceInMeters = null then null else Number.Round(distanceInMeters / 1000, 2),

        // Convert the MultiLineString feature to text
        multiLineStringText = if multiLineStringFeature = null then null else Text.FromBinary(Json.FromValue(multiLineStringFeature)),

        // Construct the output object
        result = [
            multiLineStringFeatureAsText = multiLineStringText,
            distanceInKm = distanceInKm,
            durationInMinutes = durationInMinutes,
            durationTrafficInMinutes = durationTrafficInMinutes
        ]
    in
        result
in
    ExtractMultiLineString
This is enough to display the routes in Icon Map Pro, but some of the routes I'd requested are long, far exceeding the maximum length of a field in Power BI. While the report handles this by splitting these long routes into multiple rows, I decided to convert the GeoJSON returned by Azure Maps to Well-Known Text format, which is slightly more compact.
Again to do this I created a function, which also reduces the decimal precision of the coordinates, to further reduce the number of characters used:
let
    GeoJSONToWKT = (geoJsonText as text, precision as number) =>
    let
        // Parse the GeoJSON text to a record
        geoJson = Json.Document(geoJsonText),

        // Extract the geometry and its type
        geometry = geoJson[geometry],
        geometryType = Text.Upper(geometry[type]),
        coordinates = geometry[coordinates],

        // Function to format a single coordinate with the specified precision
        FormatCoordinate = (coord as number) =>
            Number.ToText(Number.Round(coord, precision), "F" & Number.ToText(precision)),

        // Function to format a single point (lon, lat)
        FormatPoint = (point as list) =>
            Text.Combine(List.Transform(point, each FormatCoordinate(_)), " "),

        // Function to format a list of points (e.g., for LineString)
        FormatLineString = (line as list) =>
            "(" & Text.Combine(List.Transform(line, each FormatPoint(_)), ", ") & ")",

        // Function to format a list of LineStrings (e.g., for MultiLineString or Polygon)
        FormatMultiLineString = (lines as list) =>
            "(" & Text.Combine(List.Transform(lines, each FormatLineString(_)), ", ") & ")",

        // Function to format a list of Polygons (e.g., for MultiPolygon)
        FormatMultiPolygon = (polygons as list) =>
            "(" & Text.Combine(List.Transform(polygons, each FormatMultiLineString(_)), ", ") & ")",

        // Match geometry type and convert to WKT
        WKT =
            if geometryType = "POINT" then
                "POINT (" & FormatPoint(coordinates) & ")"
            else if geometryType = "MULTIPOINT" then
                "MULTIPOINT " & FormatLineString(coordinates)
            else if geometryType = "LINESTRING" then
                "LINESTRING " & FormatLineString(coordinates)
            else if geometryType = "MULTILINESTRING" then
                "MULTILINESTRING " & FormatMultiLineString(coordinates)
            else if geometryType = "POLYGON" then
                "POLYGON " & FormatMultiLineString(coordinates)
            else if geometryType = "MULTIPOLYGON" then
                "MULTIPOLYGON " & FormatMultiPolygon(coordinates)
            else
                error "Unsupported geometry type: " & geometryType
    in
        WKT
in
    GeoJSONToWKT
And then finally, I created one further function to generate a random color to assign to each route:
let
    GenerateDarkHexColorFromSeed = (seed as text) =>
    let
        // Convert the seed text into a list of character codes
        charCodes = List.Transform(Text.ToList(seed), each Character.ToNumber(_)),

        // Sum the character codes to create a simple numeric seed
        numericSeed = List.Sum(charCodes),

        // Generate pseudo-random RGB values using the numeric seed
        red = Number.Mod(numericSeed * 37, 256),
        green = Number.Mod(numericSeed * 59, 256),
        blue = Number.Mod(numericSeed * 73, 256),

        // Adjust RGB values to ensure they are dark enough
        minBrightness = 100, // Minimum brightness for each channel
        darkRed = if red > 255 - minBrightness then 255 - minBrightness else red,
        darkGreen = if green > 255 - minBrightness then 255 - minBrightness else green,
        darkBlue = if blue > 255 - minBrightness then 255 - minBrightness else blue,

        // Convert each component to a two-digit hexadecimal string
        redHex = Text.PadStart(Number.ToText(Number.RoundDown(darkRed), "X"), 2, "0"),
        greenHex = Text.PadStart(Number.ToText(Number.RoundDown(darkGreen), "X"), 2, "0"),
        blueHex = Text.PadStart(Number.ToText(Number.RoundDown(darkBlue), "X"), 2, "0"),

        // Combine the components into a hex color string
        hexColor = "#" & redHex & greenHex & blueHex
    in
        hexColor
in
    GenerateDarkHexColorFromSeed
I use this to create an SVG image that I show at the end of the lines, and also in the table. The image is created as a DAX measure, so I can assign the color dynamically:
Destination Image = "data:image/svg+xml,<svg xmlns=""http://www.w3.org/2000/svg"" width=""20"" height=""20"" viewBox=""0 0 20 20""><circle cx=""10"" cy=""10"" r=""10"" fill=""" & SUBSTITUTE( MAX (Routes[Color]), "#", "%23") & """/></svg>"
Below is the final report.
If you'd like to see how the report was built, you can download it here. You will need to obtain an Azure Maps API key from the Azure Admin portal to use in the Power Query API parameter.