
Yesterday Microsoft published a blog post about Isochrones in the Azure Maps Route Range API. Isochrones are a great way to represent the amount of time it takes to travel from a point. We've included an isochrone example in our sample Power BI report file since we launched Icon Map Pro six months or so ago.
With Microsoft now supporting isochrones in geoJSON format as part of their API, I was keen to see if I could incorporate this into Power BI's data load processes using Power Query, without needing to use a Python notebook.
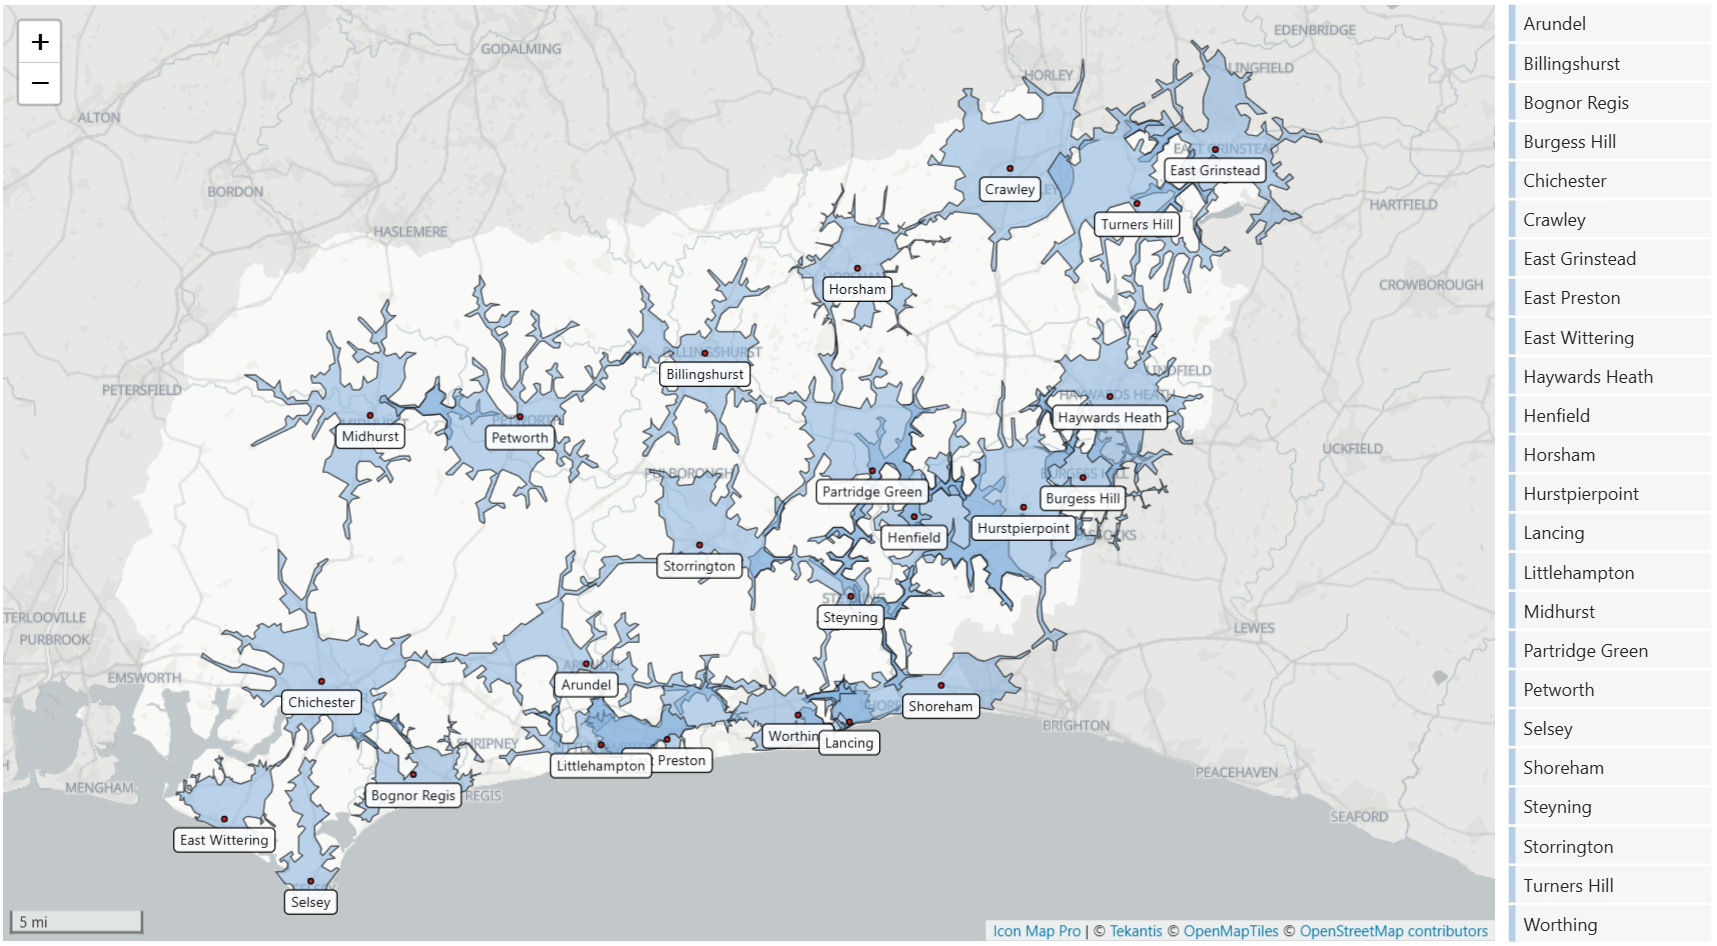
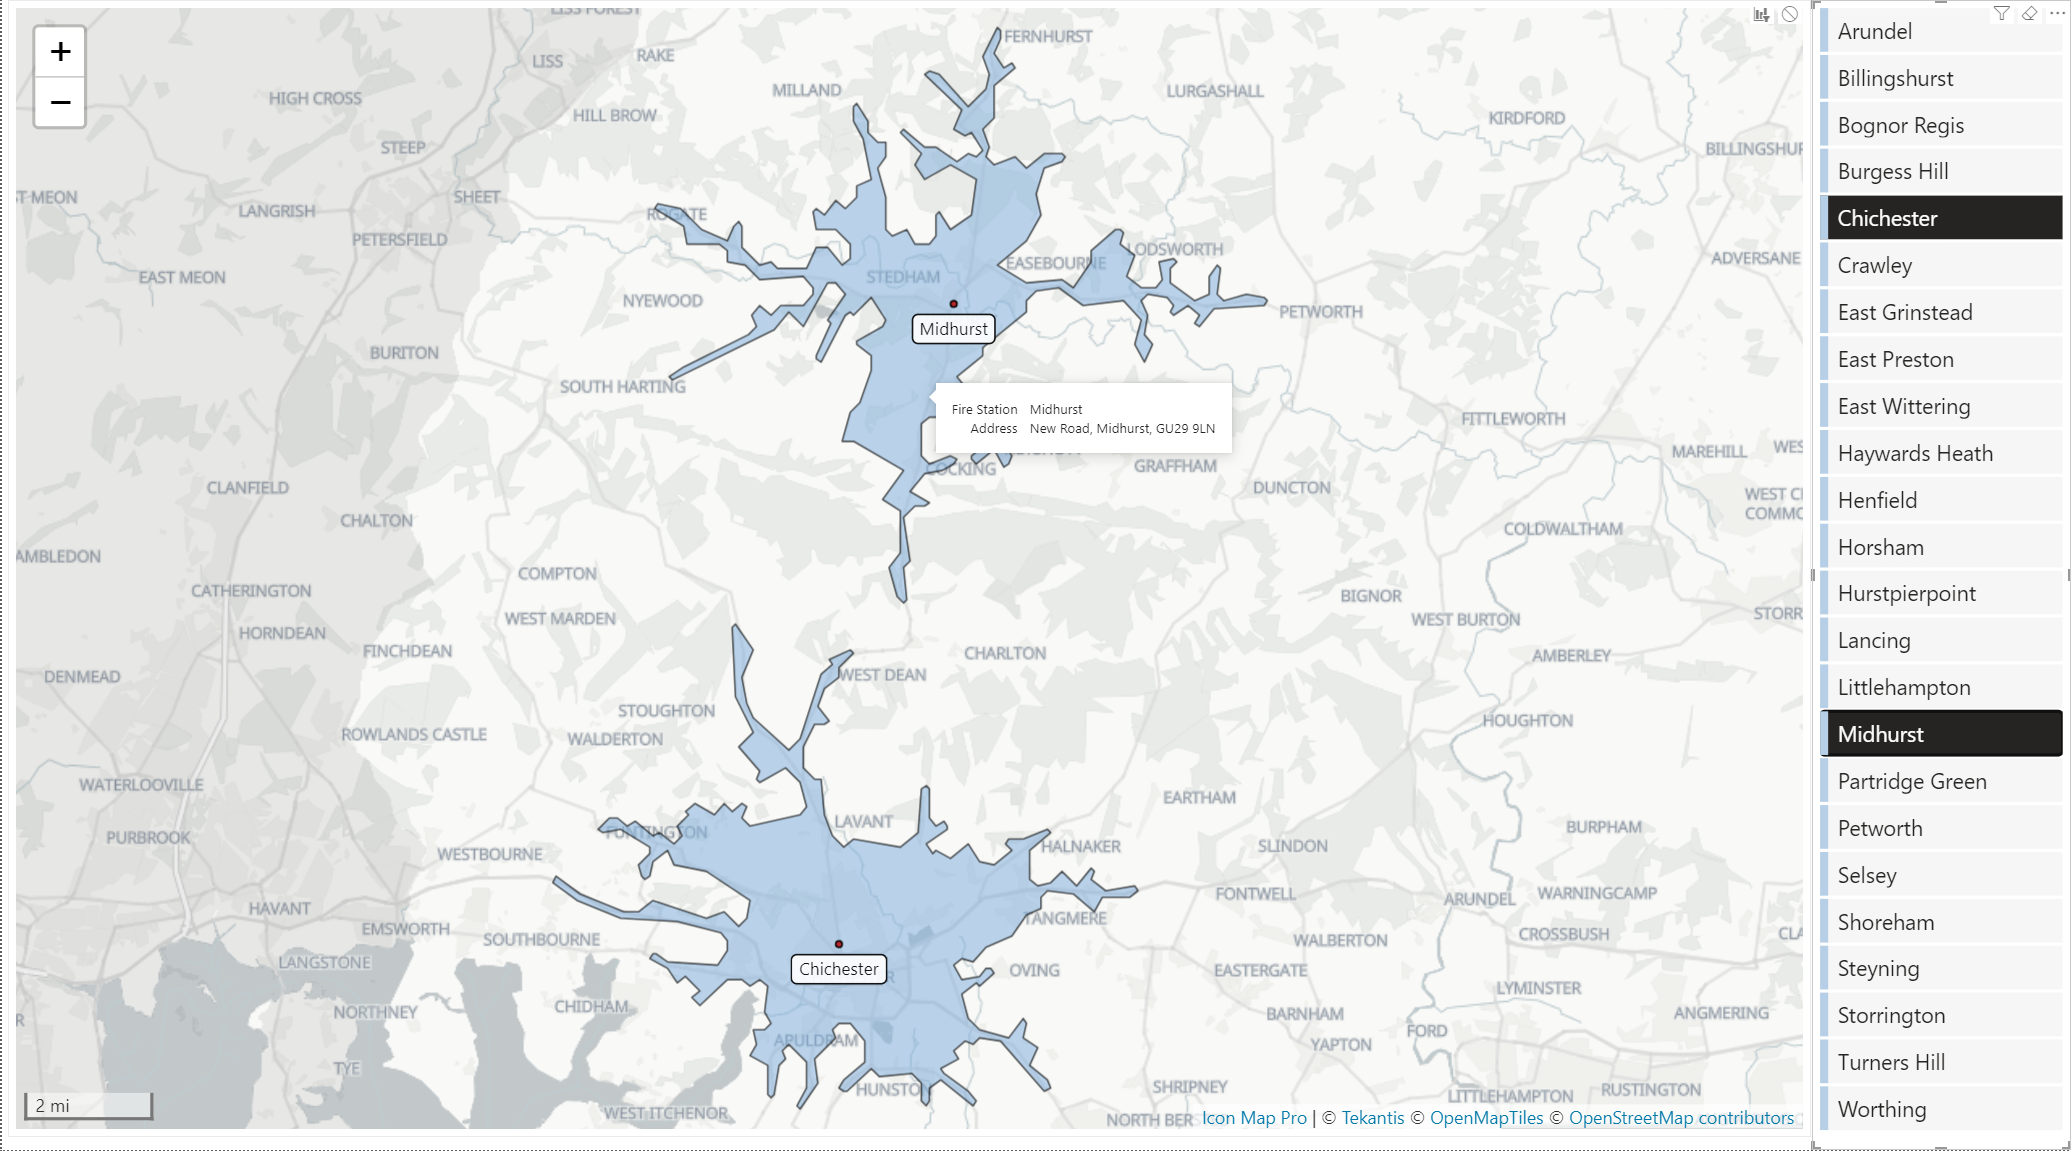
To test this out I've built a report that shows the extent that all the fire stations in West Sussex can reach within a 10 minute drive time.
I started with a list of fire stations, their addresses and the corresponding longitudes and latitudes:
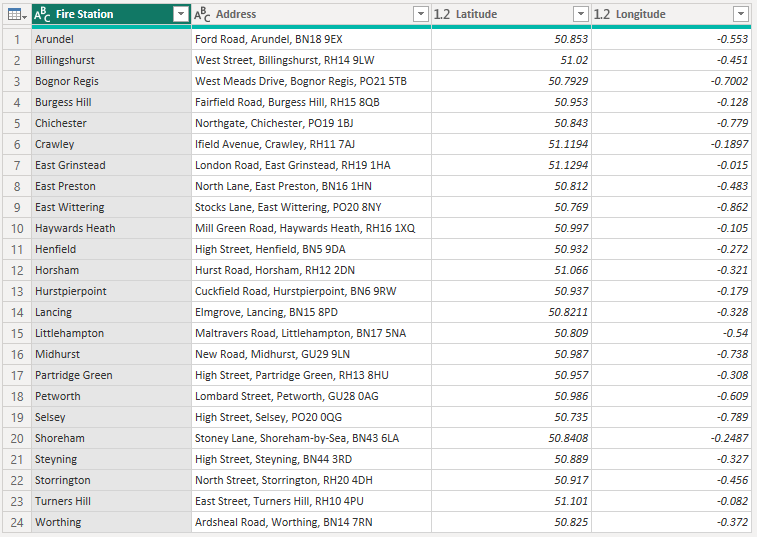
The plan was to use the coordinates as the start points for the drive time call for the Azure Maps API.
I created a Power Query function to call the API, which I then call for each fire station:
let

    CallAzureMapsRangeApi = (ApiKey as text, Longitude as number, Latitude as number, TimeBudget as number, TravelMode as text, Height as number, Length as number, Width as number) as text =>
    let
        // Define the API endpoint
        ApiUrl = "https://atlas.microsoft.com/route/range?api-version=2024-07-01-preview&subscription-key=" & ApiKey,

        // Create the request body
        RequestBody = Text.FromBinary(Json.FromValue([
            type = "Feature",
            geometry = [
                type = "Point",
                coordinates = {Longitude, Latitude}
            ],
            properties = [
                timeBudgetInSec = TimeBudget,
                travelMode = TravelMode,
                vehicleSpec = [
                    height = Height,
                    length = Length,
                    width = Width
                ]
            ]
        ])),

        // Define the headers
        Headers = [
            #"Content-Type" = "application/json"
        ],

        // Make the POST request
        Response = Web.Contents(ApiUrl, [
            Headers = Headers,
            Content = Text.ToBinary(RequestBody)
        ]),

        // Treat the response as plain text
        ResponseText = Text.FromBinary(Response)
    in
        ResponseText
in
    CallAzureMapsRangeApi
The function takes in your Azure Maps API key, the coordinates, amount of time, vehicle type and dimensions of the vehicle as parameters.
Calling this returns a geoJSON file for each fire station:
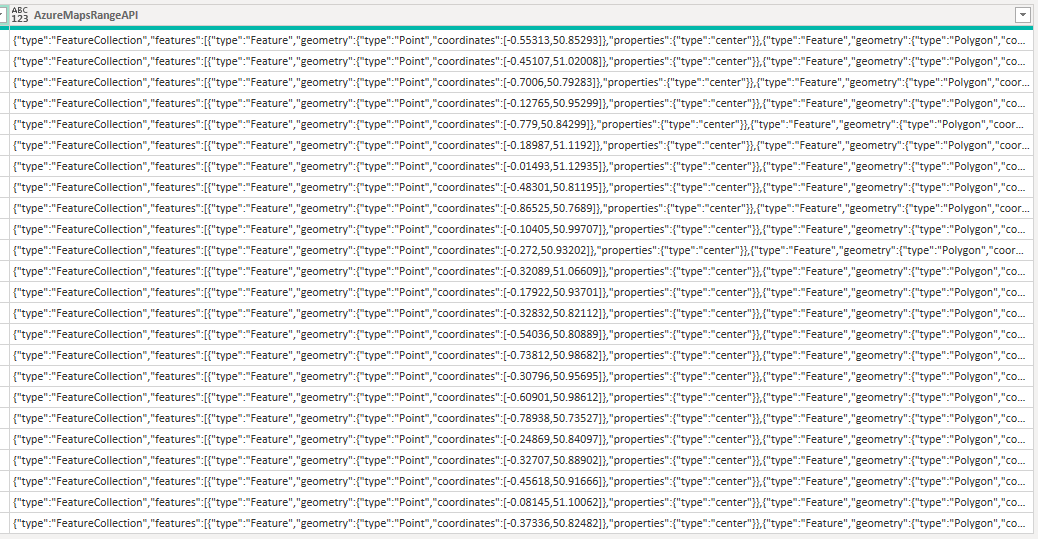
While Icon Map Pro can display geoJSON files, it can't display them when the whole file is stored in a field. It can however display geoJSON features stored in a row in your dataset, so I created another PowerQuery function to extract the isochrone polygon, and its centroid from the geoJSON:
let
    ExtractFeature = (GeoJsonText as text) as table =>
    let
        // Parse the input JSON text
        ParsedJson = Json.Document(GeoJsonText),

        // Extract the "features" array
        Features = ParsedJson[features],

        // Extract the "geometry" object for the "Polygon" type
        PolygonGeometry = List.First(
            List.Select(Features, each _[geometry][type] = "Polygon")
        )[geometry],

        // Extract coordinates for the "Point" type
        PointFeature = List.First(
            List.Select(Features, each _[geometry][type] = "Point")
        ),

        PointCoordinates = PointFeature[geometry][coordinates],
        Longitude = PointCoordinates{0},
        Latitude = PointCoordinates{1},

         // Convert the Polygon object to JSON text
        PolygonText = Text.FromBinary(Json.FromValue([
            type = PolygonGeometry[type],
            coordinates = PolygonGeometry[coordinates]
        ])),

        // Prepare the output table
        Result = Table.FromRecords({
            [
                Longitude = Longitude,
                Latitude = Latitude,
                Polygon = PolygonText
            ]
        })
    in
        Result
in
    ExtractFeature
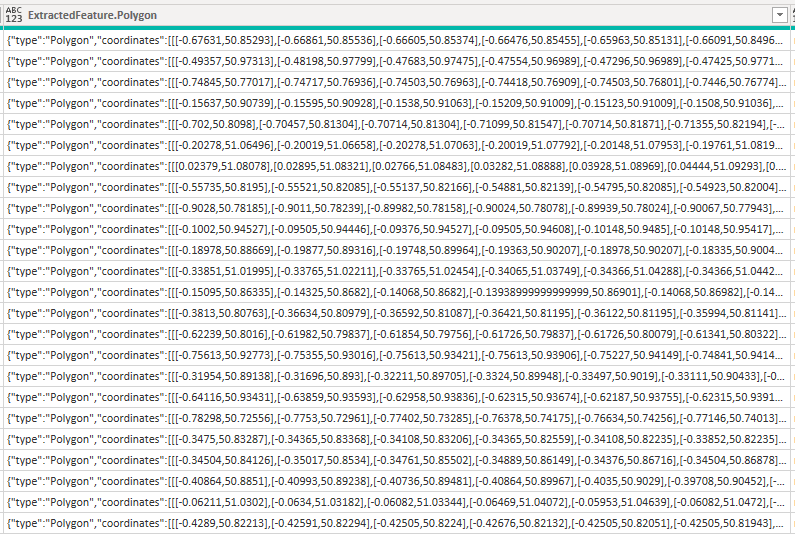
From this we now just have the Polygon feature for each isochrone, and not the whole file.
This is enough to display the isochrones on the map, but I also wanted to add a circle showing the centroid, and add a label with the fire station name. To do this I added another set of rows for each fire station with the longitude and latitude, and appended it to the fire stations table. Now I have a set of rows for each isochrone, and a set of rows for each centroid.
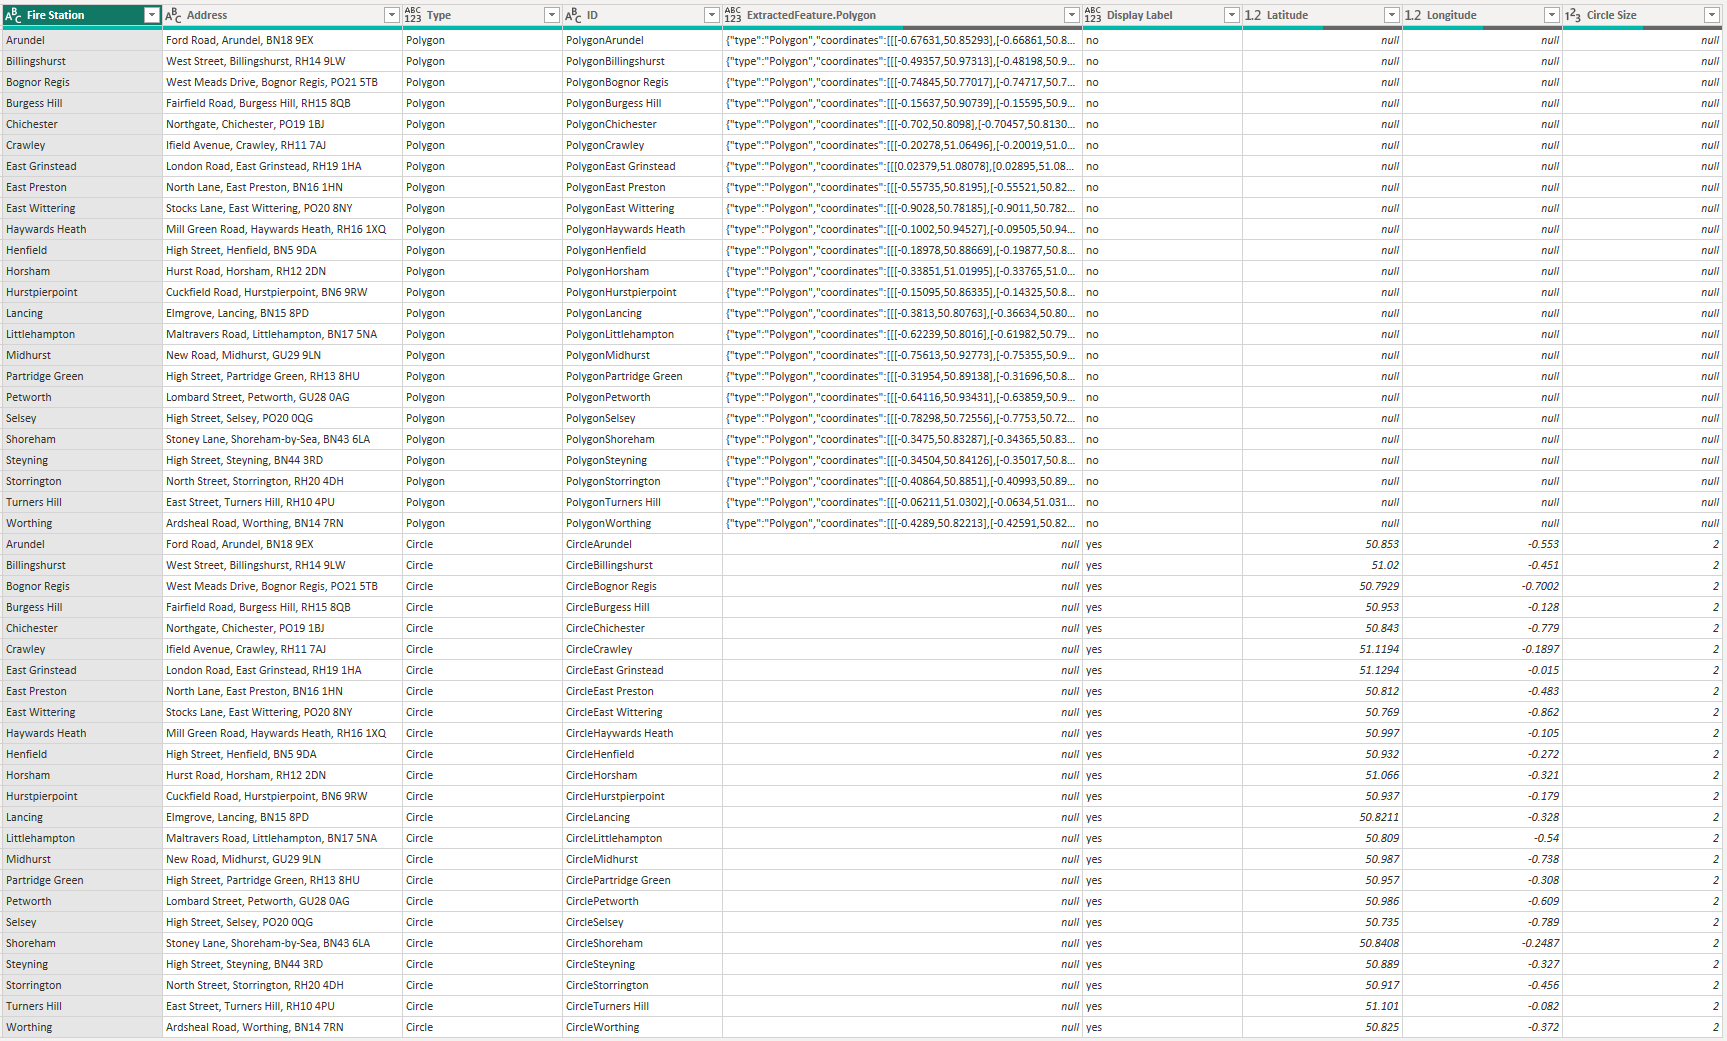
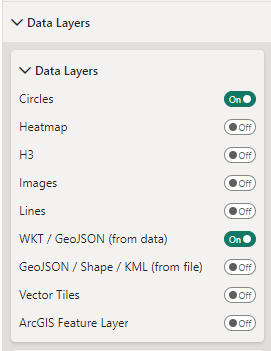
Then in Icon Map Pro, I've enabled the circle layer, and WKT / GeoJSON (from data) layer and dragged in the corresponding fields. I also set up the label to show below the circles.
Finally I added in a reference layer with the UK's local authorities - but with West Sussex deleted. This meant that I could highlight the West Sussex area on the map.
The last touch was to add tooltips, and a Power BI slicer to be able to zoom in to specific fire stations.
If you'd like to see how the report was built, you can download it here. You will need to obtain an Azure Maps API key from the Azure Admin portal to use in the Power Query API parameter.
Source of local authority boundaries: Office for National Statistics licensed under the Open Government Licence v.3.0. Contains OS data © Crown copyright and database right 2024