Some of the companies that use Icon Map
Icon Map - Location
Intelligence for
 Power BI
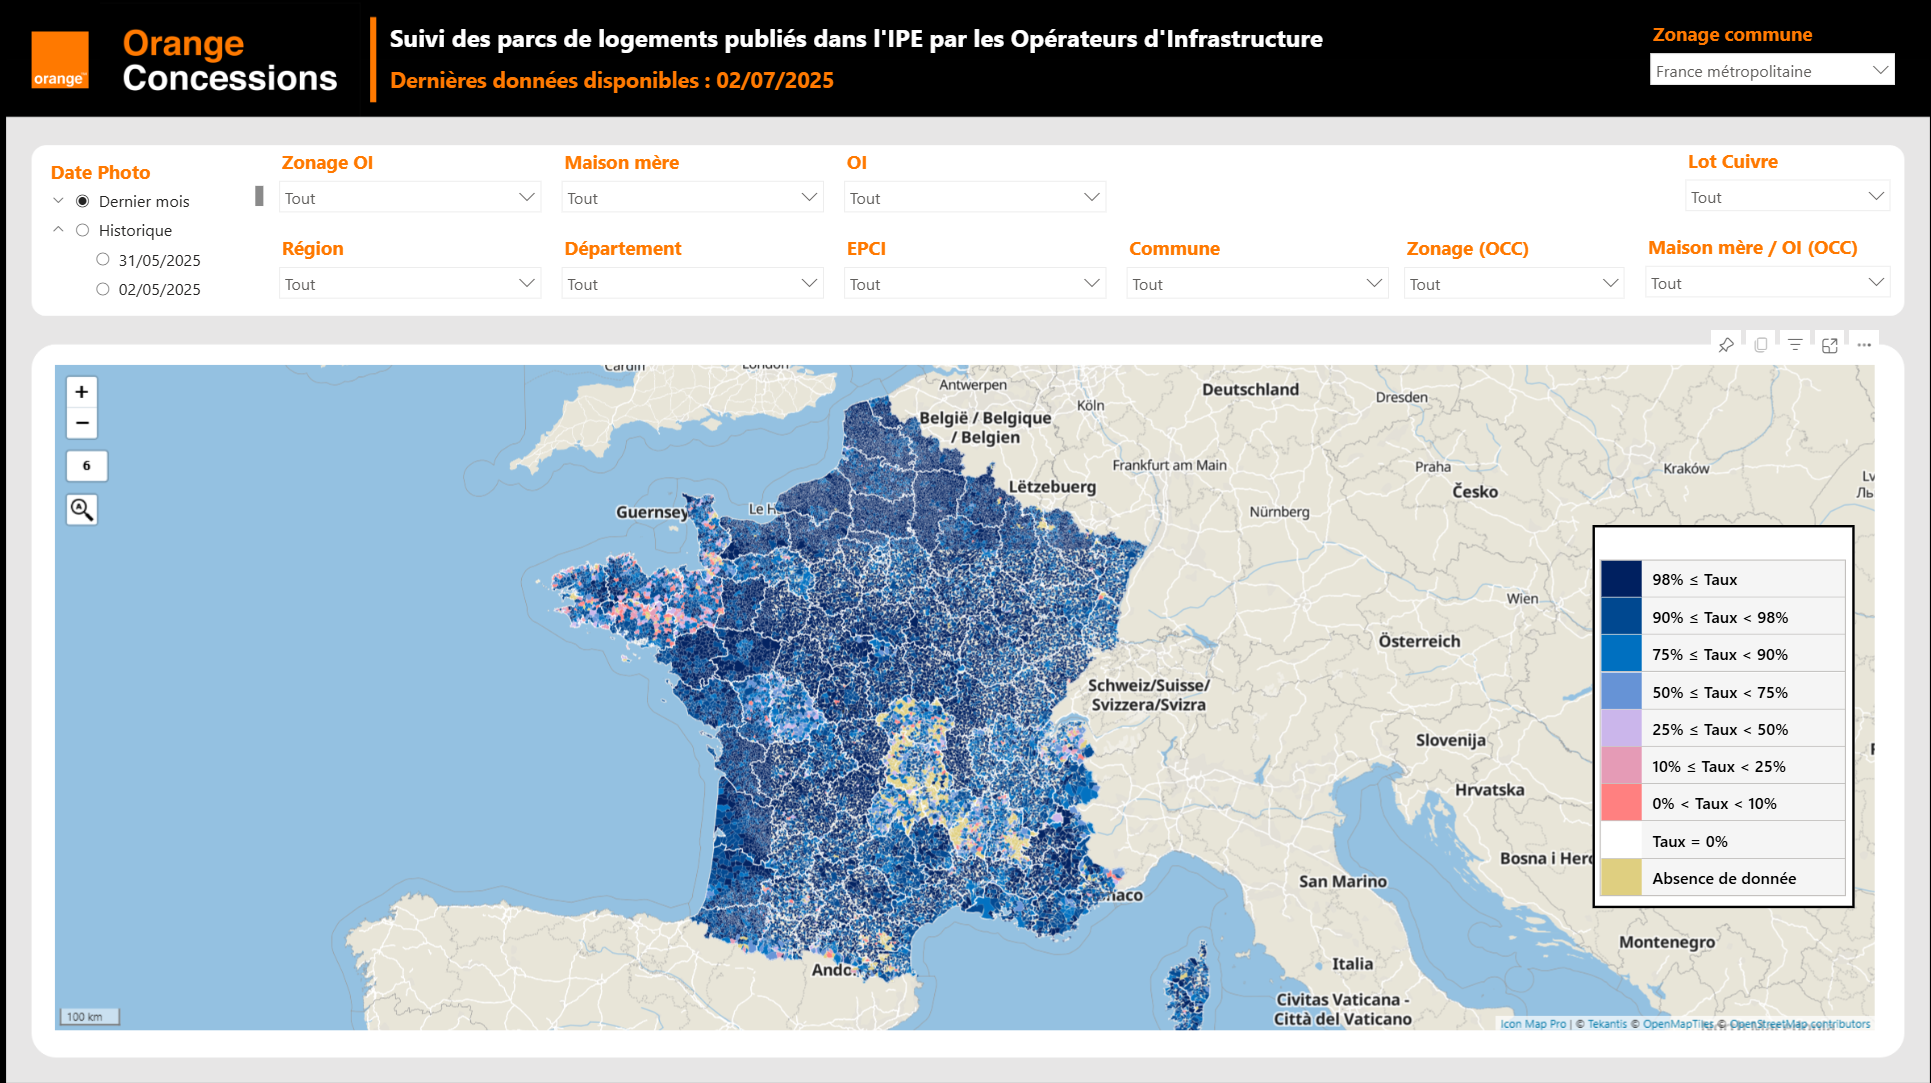
Icon Map Pro and Icon Map Slicer are powerful custom map
visuals
for Microsoft Power BI that unlock mapping capabilities far beyond the built-in options.
They let you work with custom basemaps, advanced layers, and dynamic styling, so you can create
clear, interactive maps
that fit your data and your story.
Whether you're plotting thousands of points, analyzing regions, or building highly
tailored geospatial dashboards, these visuals give you the flexibility and performance to make
maps a central part of your reporting.
Everything You
Need to Build Stunning Maps in Power BI
Two
map visuals to cover every scenario

Icon
Map Pro
Purpose-built for enterprise reporting, Icon Map Pro brings high-performance, multi-layer
spatial analytics into the hands of everyday Power BI users.
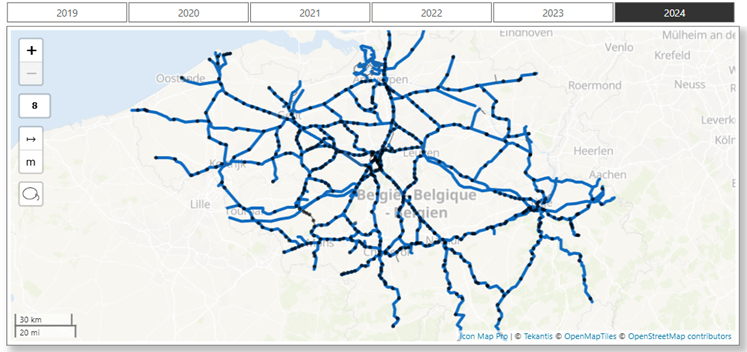
Create advanced geospatial visualisations with support for circles, clusters, icons, images,
lines, polygons, H3 hexagons, and heatmap layers.

Icon
Map
Slicer
A powerful visual purpose-built as a slicer for Power BI. Drive analysis directly from
the map with intuitive selection tools, dynamic field-of-view filtering, and cross-page syncing.
Enhanced 3D capabilities let you visualise terrain and data in three dimensions.
Looking for Icon Map v3?
The older Icon Map v3 map visual was retired from Microsoft AppSource in March 2025 and is no longer
supported. Upgrade now to benefit from full support and extensive additional capabilities with
Icon Map Pro and Icon Map Slicer.