
Icon Map
Usage & Instructions
This section provides instructions and guidance on how to use the various features of Icon Map. The ambition is to include a video and downloadable example for each scenario.
Circles
Contents
- Circle sizes and colors based on the formatting settings
- Border and fill colors and opacity set by DAX measures
- Tooltips
- Drilldown
In order to draw circles on the map, the Category, Longitude, Latitude and Size fields must be populated.
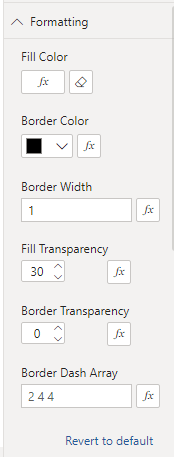
The fill color, border color, border width, transparency and border pattern can be set using the formatting options. Each of these options can be specified for each circle individually using expression based formatting.
A number of settings within the "Objects" pane relate to circles:
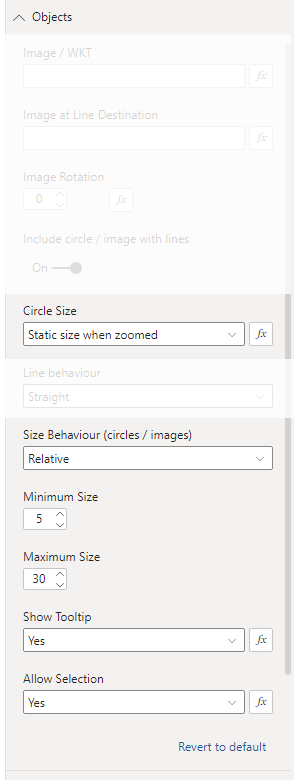
Circle Size. Static size when zoomed - the circle will always stay the same size in pixels as the map is zoomed in or out. Diameter in meters - the circle will draw with a set diameter specified in meters based on the value in the "Size" field. This can be configured for each circle using expression based formatting - create a measure that returns the same text as shown in the dropdown box.
Size Behaviour - Relative - the circles will be drawn with a diameter between specified Minimum Size and Maximum Size with the lowest values in the data being draw with the minimum size - and the highest values having the maximum size. Values in are scaled between these two values. Explicit - circles are drawn with a diameter in pixels based on the value in the "Size" field.
Show Tooltip - enable a tooltips. This can be configured for each circle using expression based formatting.
Allow Selection - whether a circle can be clicked on for selection or drilldown. This can be configured for each circle using expression based formatting.